I may continue updating this post for a while. This basically addresses the question of when is the virus mitigated, or even better when it is contained, and eventually when should restrictions be relaxed. So we look at South Korea compared to the three worst plagued countries in the world. We then look at three other countries in East Asia that were near China and had to deal with the virus sooner than most. We then look at a few other countries that appear to getting the virus under control. I think there is considerable value here in comparing results across several countries. All these are simple graphs pulled from the Johns Hopkins CSSE website as of 8:31:22 AM: Johns Hopkins CSSE
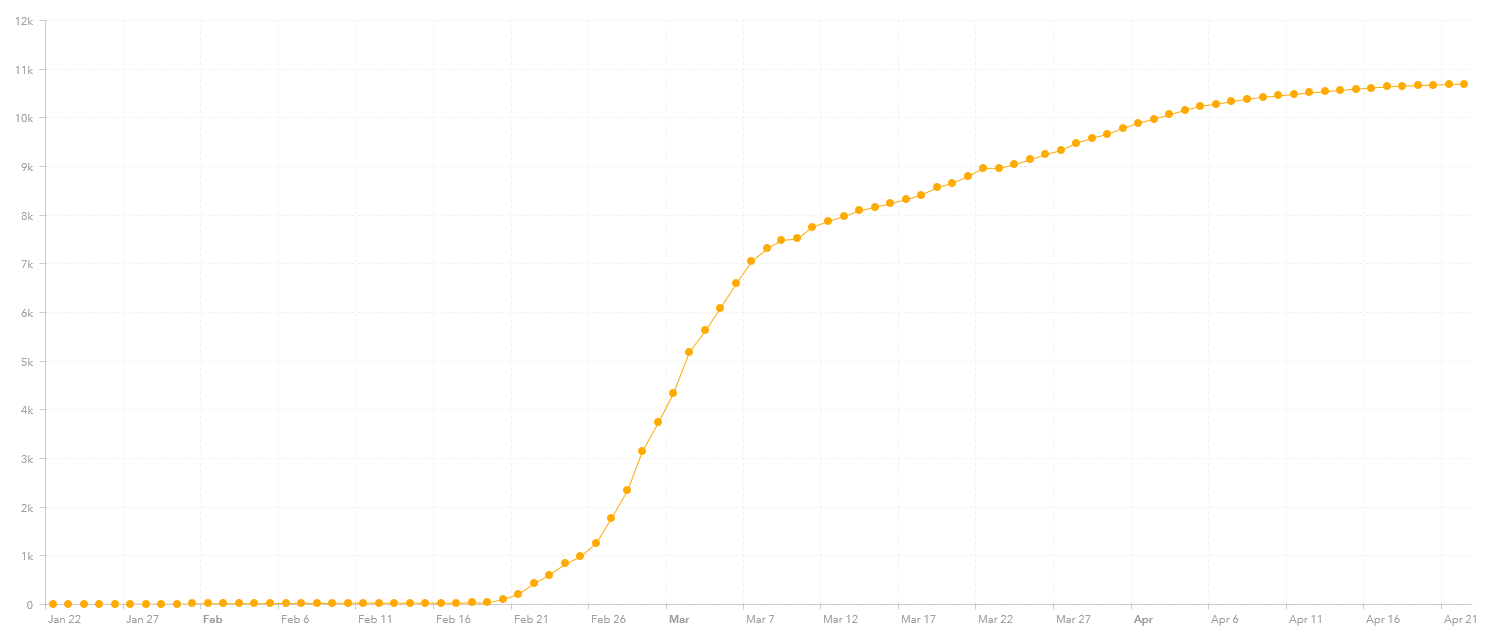
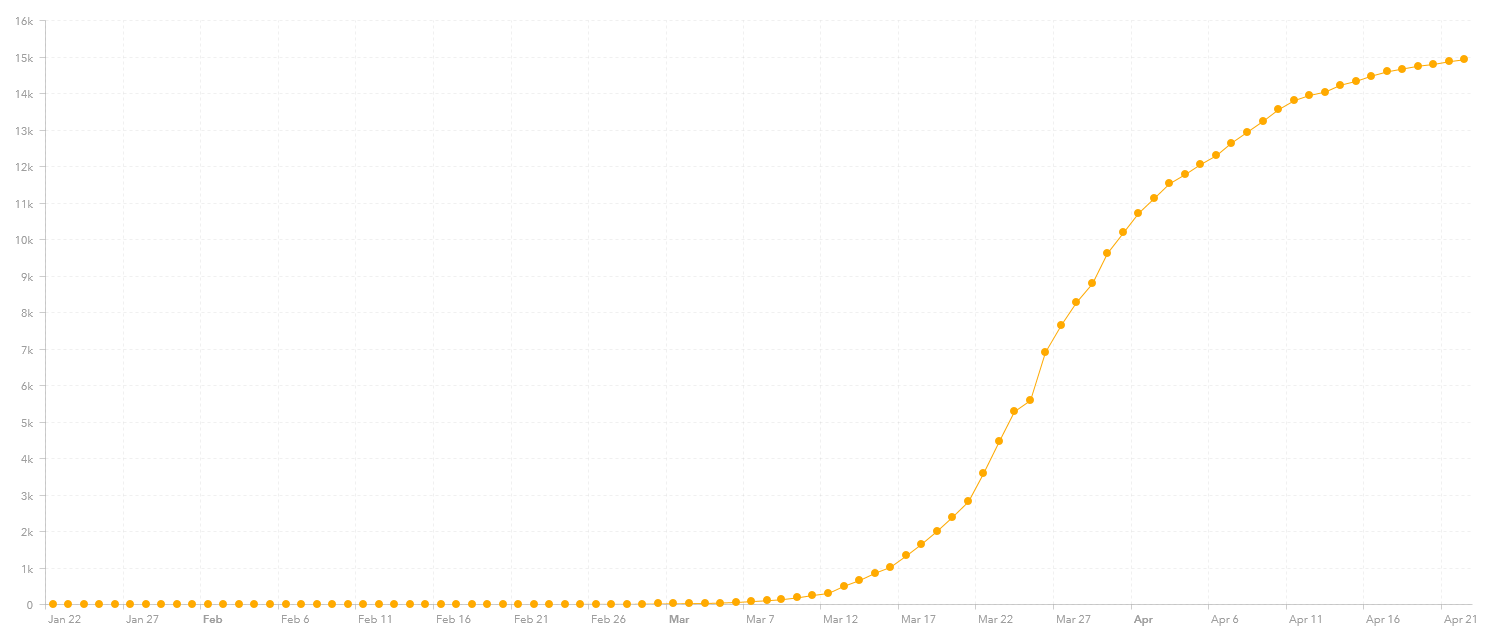
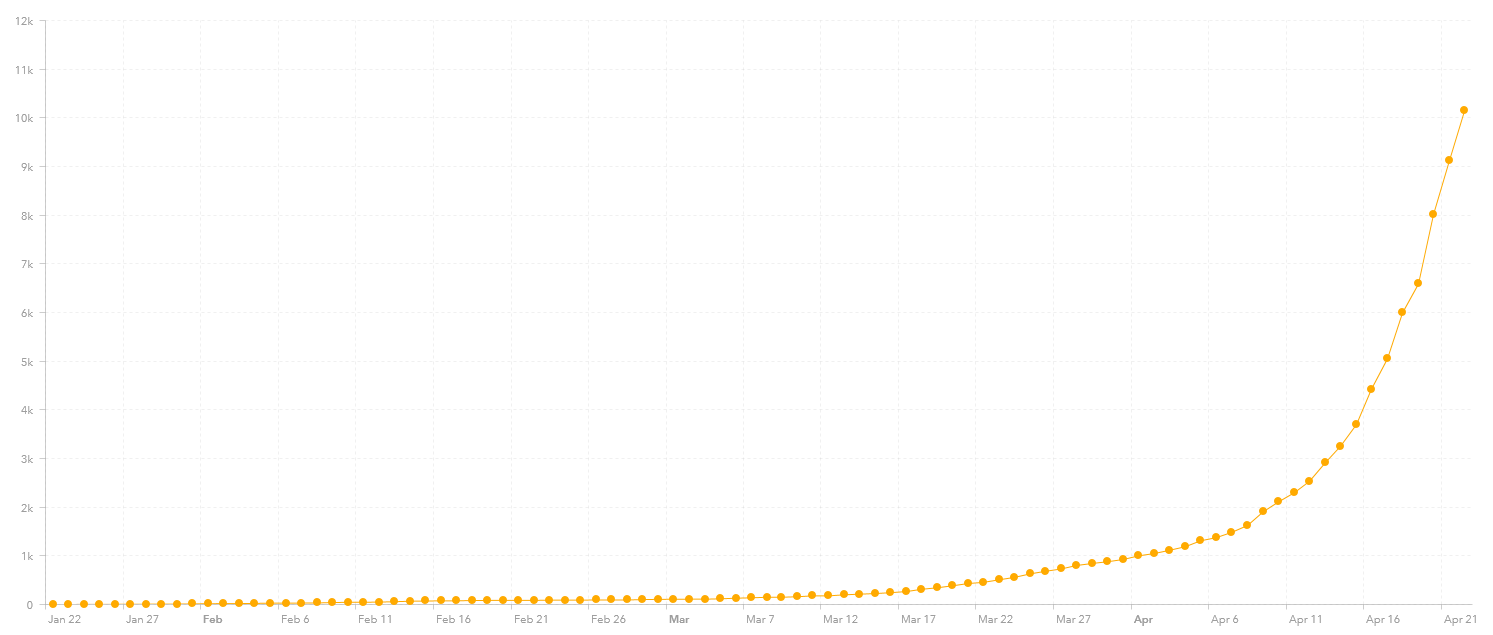
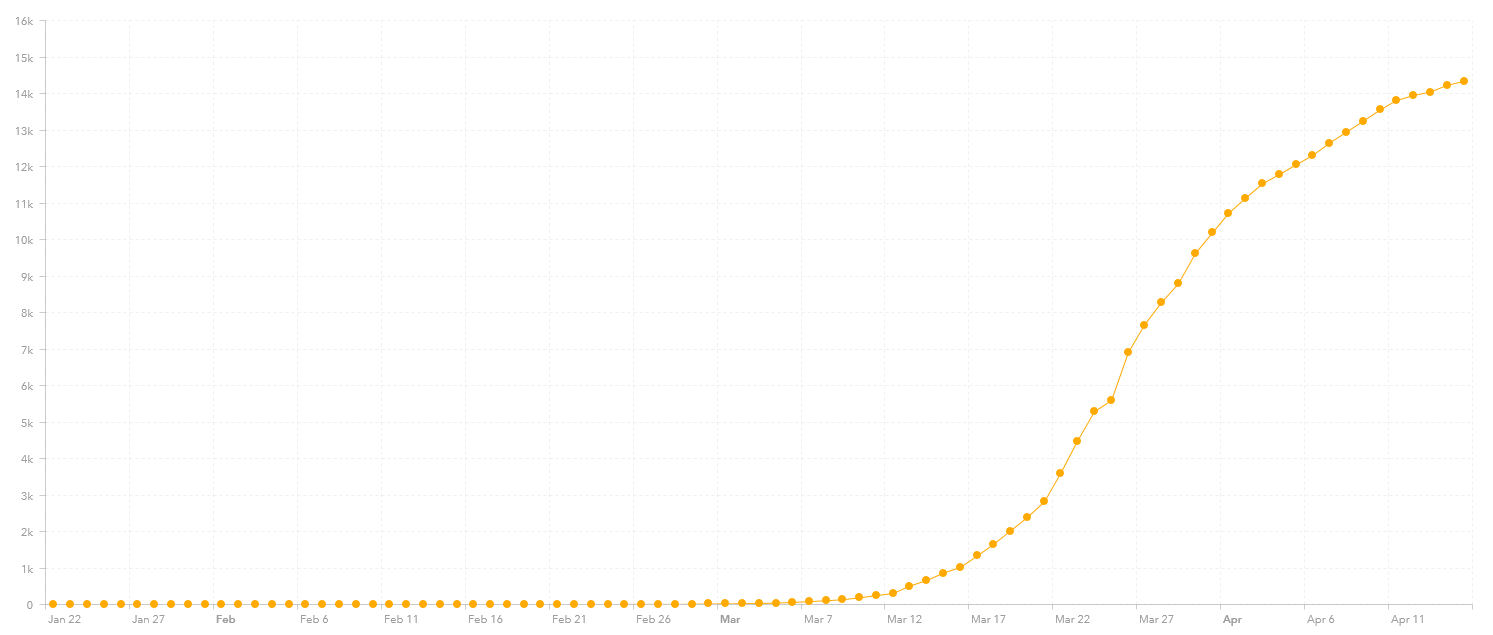
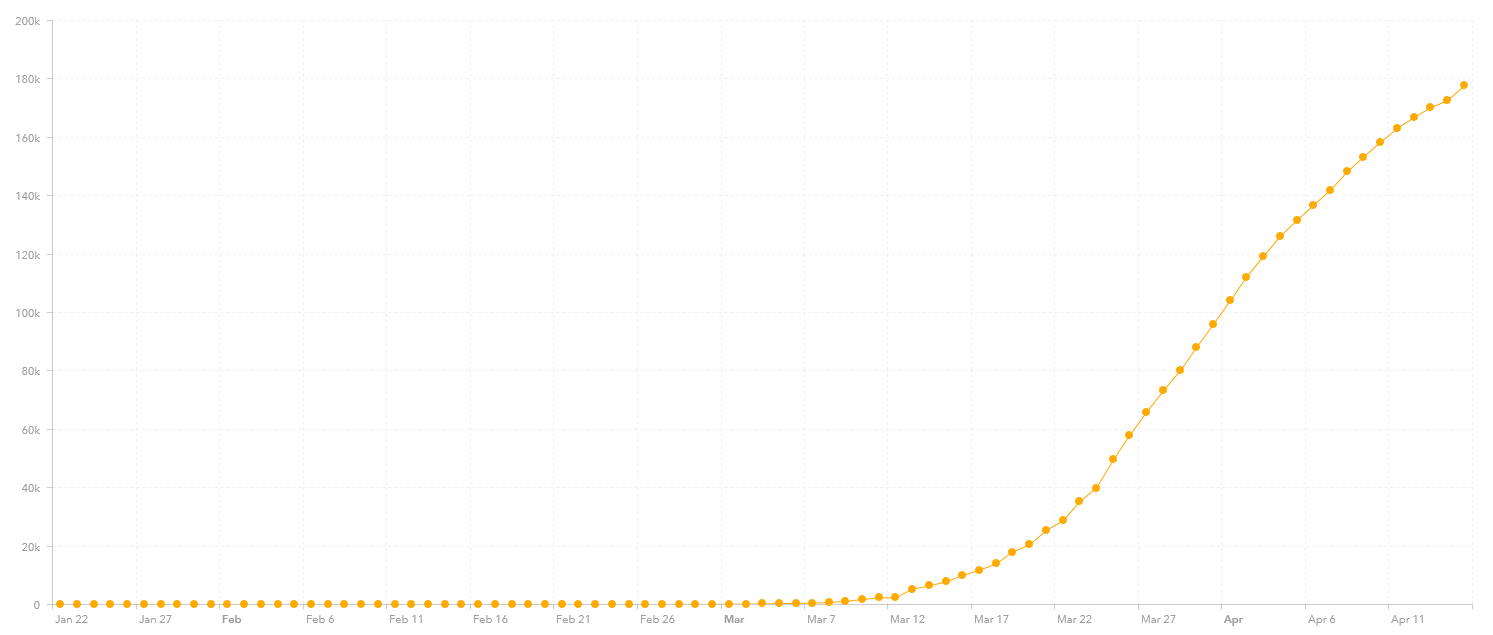
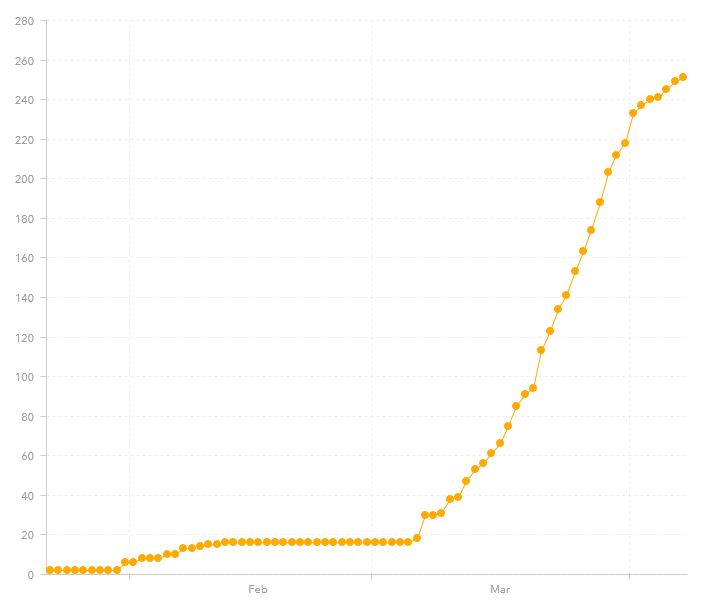
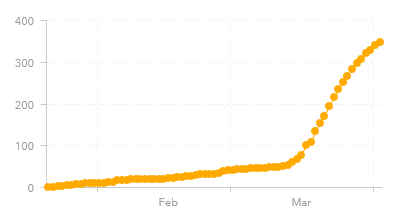
Here is the graph for the number of cases in South Korea (10,702 reported cases, only 89 more case than reported around this same time last week):
This is good. This looks like a country that now has the situation under control. Note how long it took (time is on the x-axis).
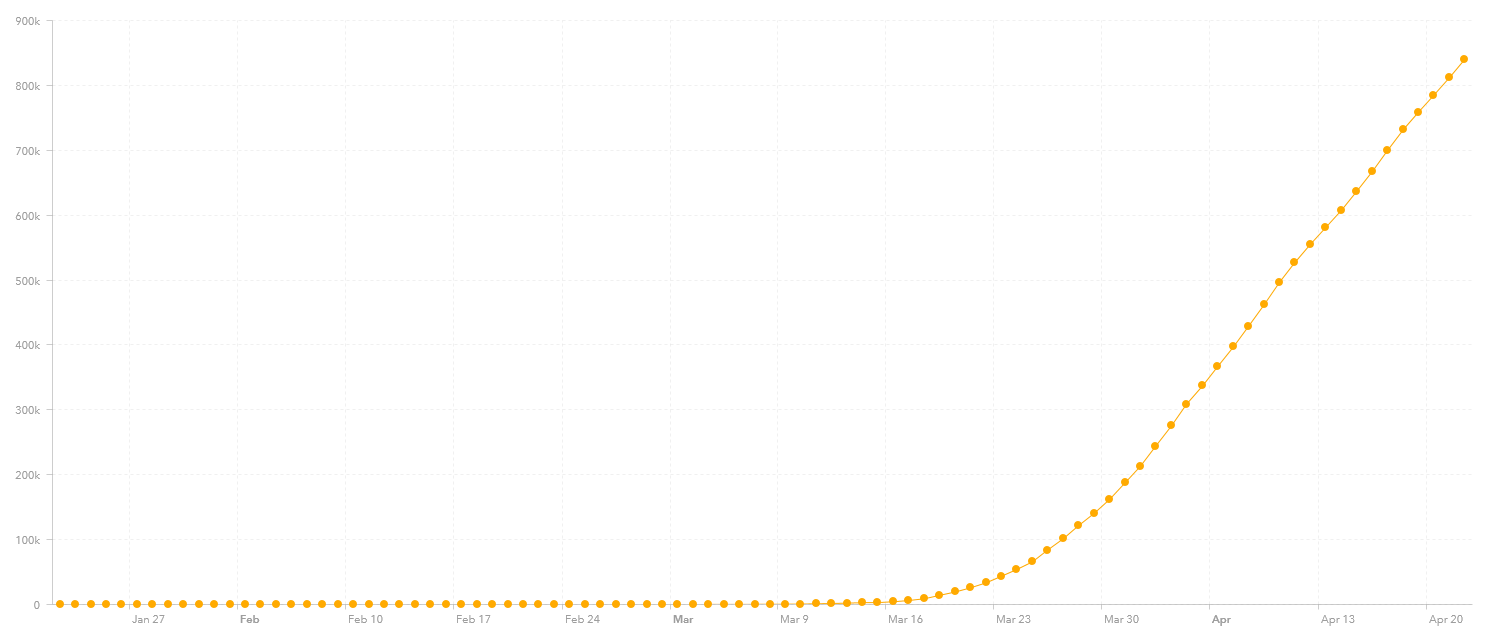
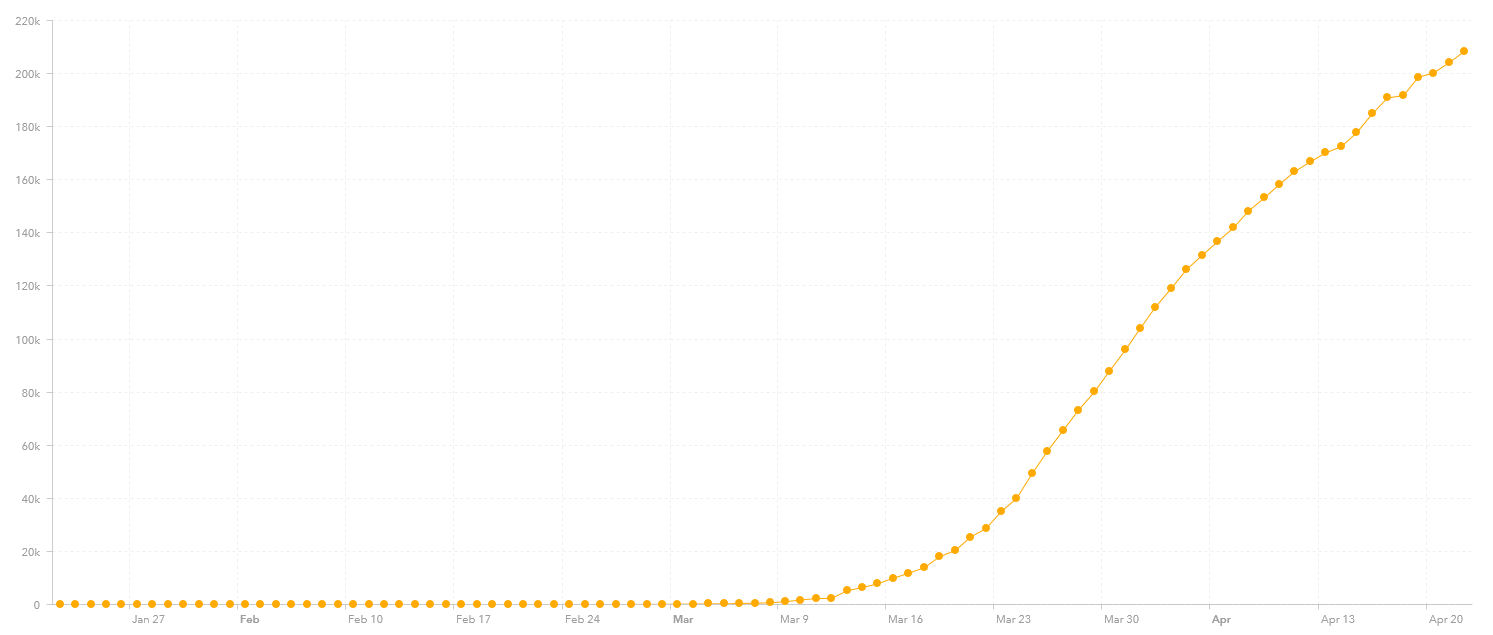
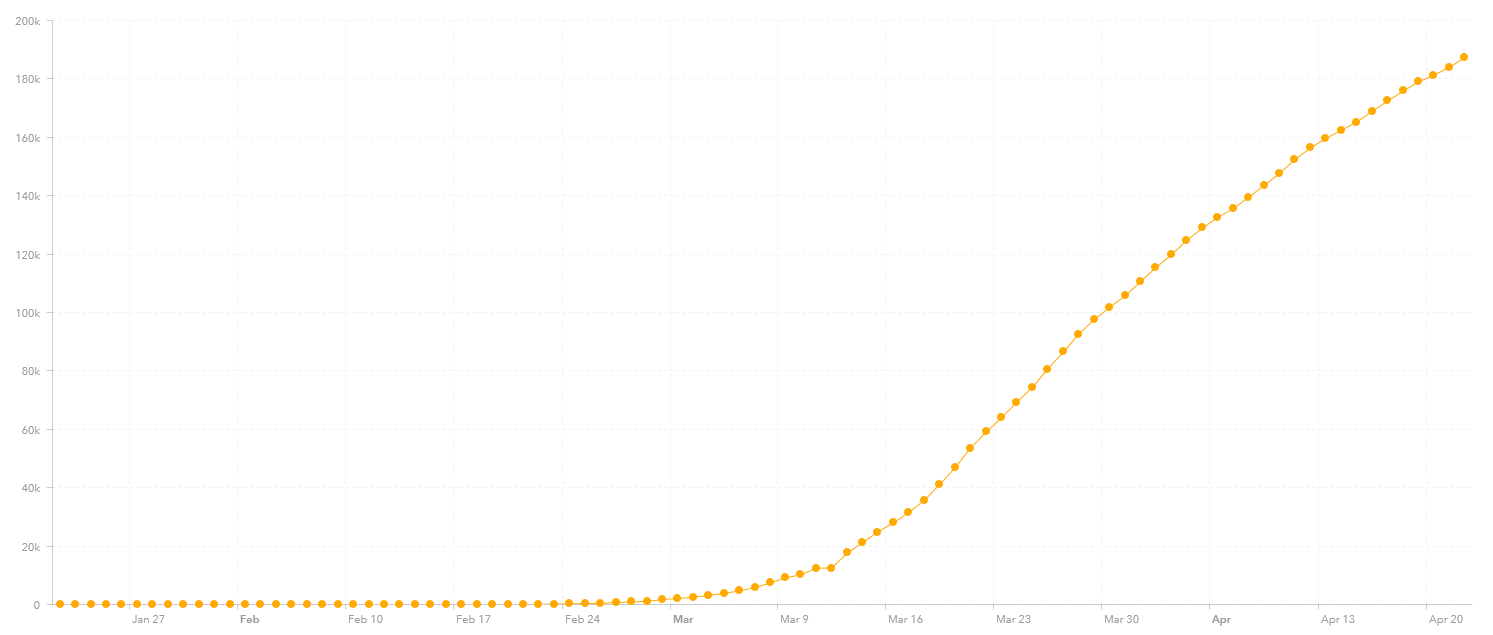
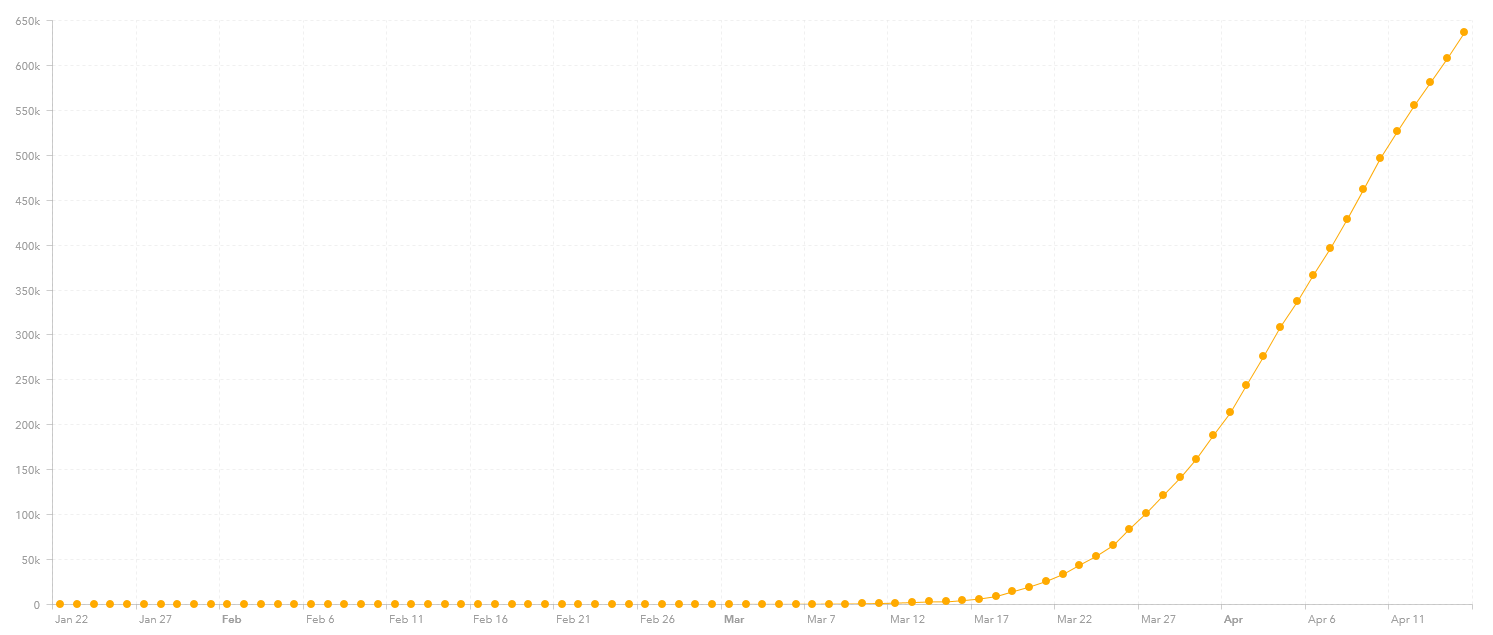
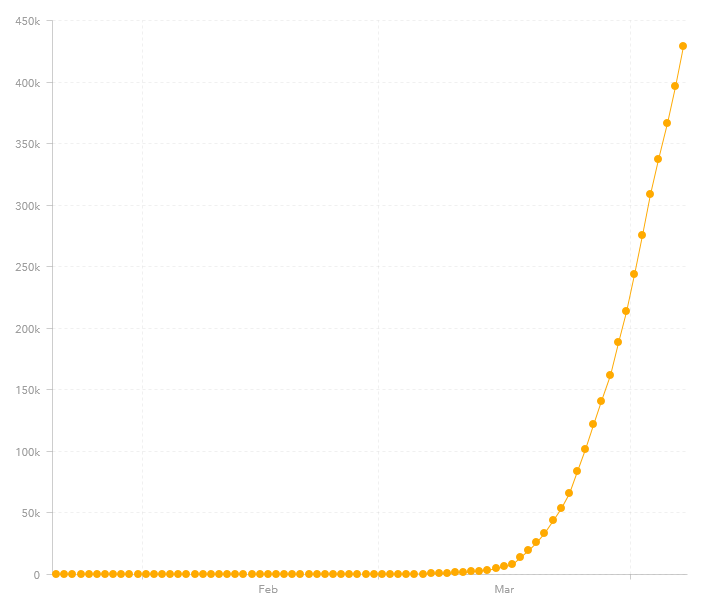
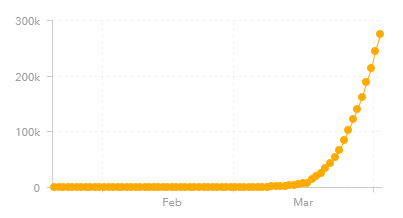
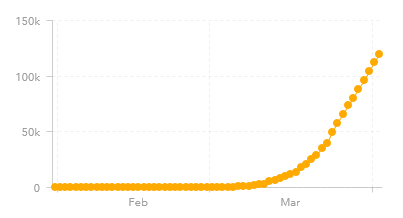
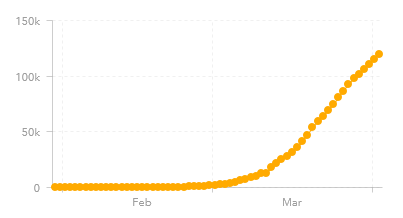
In comparison, here are the graphs for the United States (842,624 reported cases), Spain (213,024 reported cases) and Italy (187,327 reported cases). It looks like Spain and Italy are reaching their deflection point:
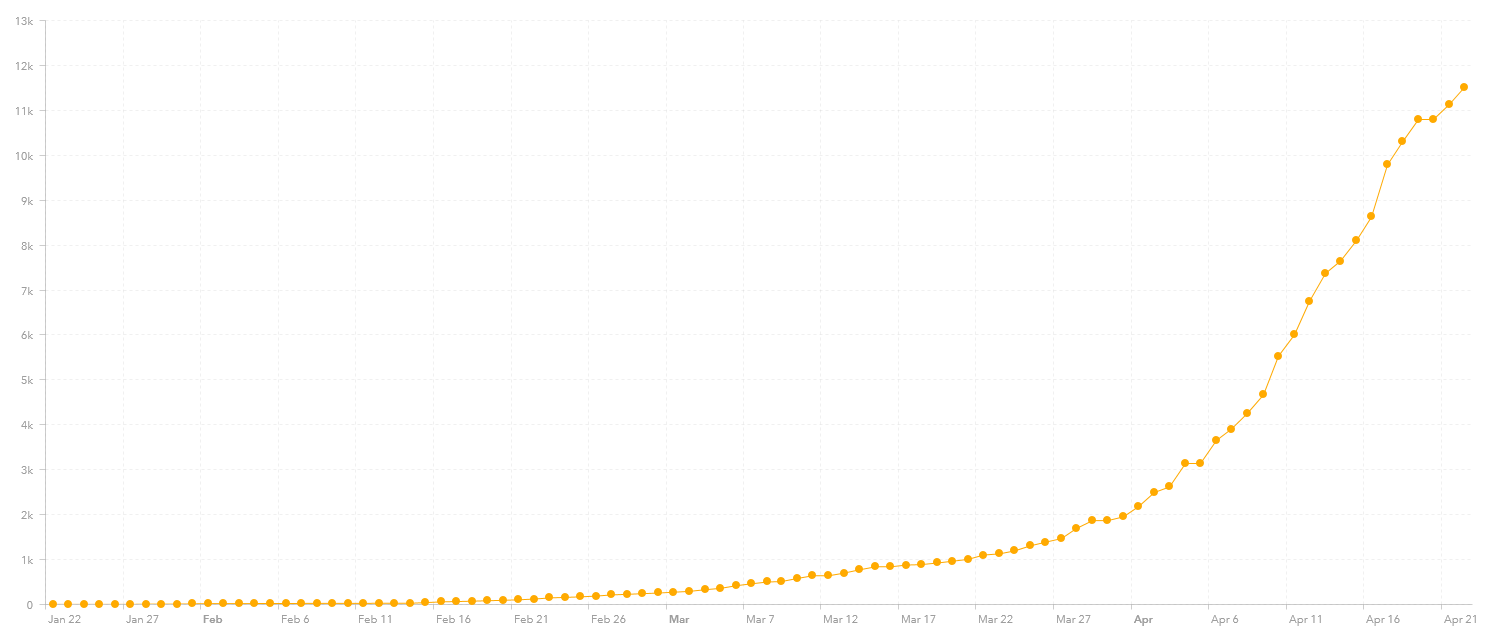
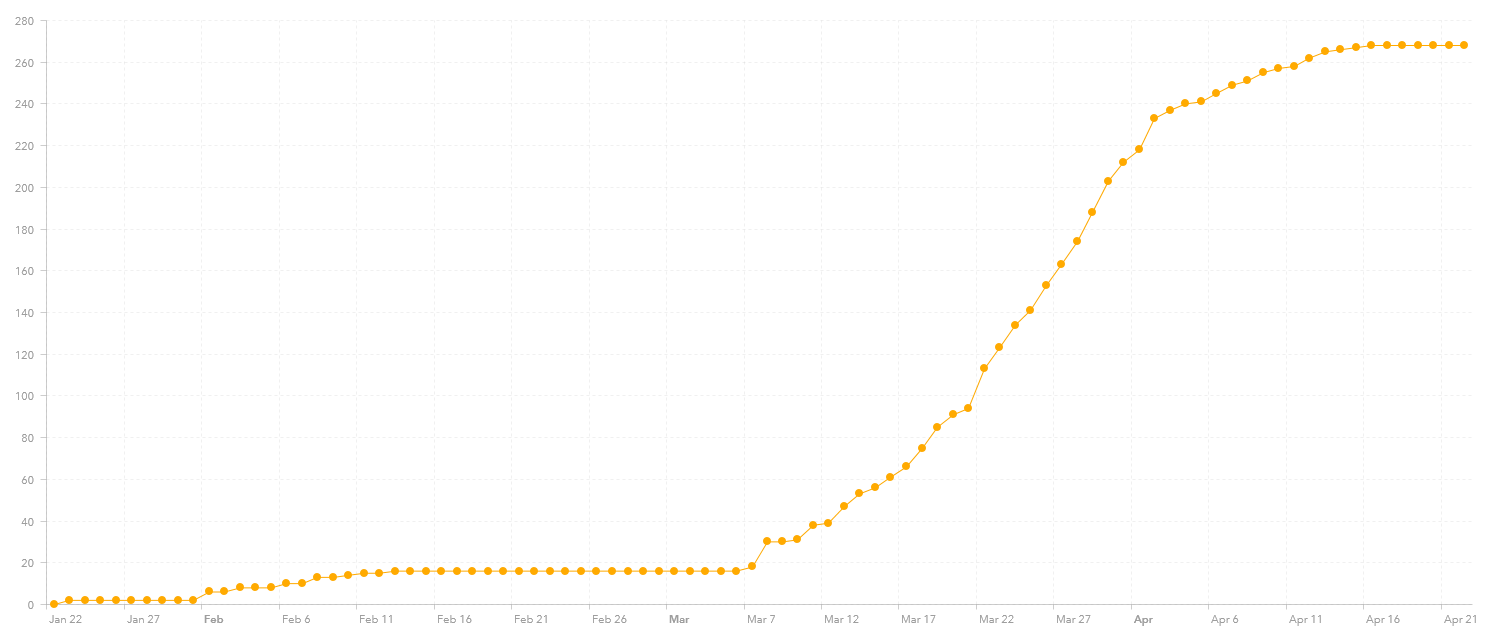
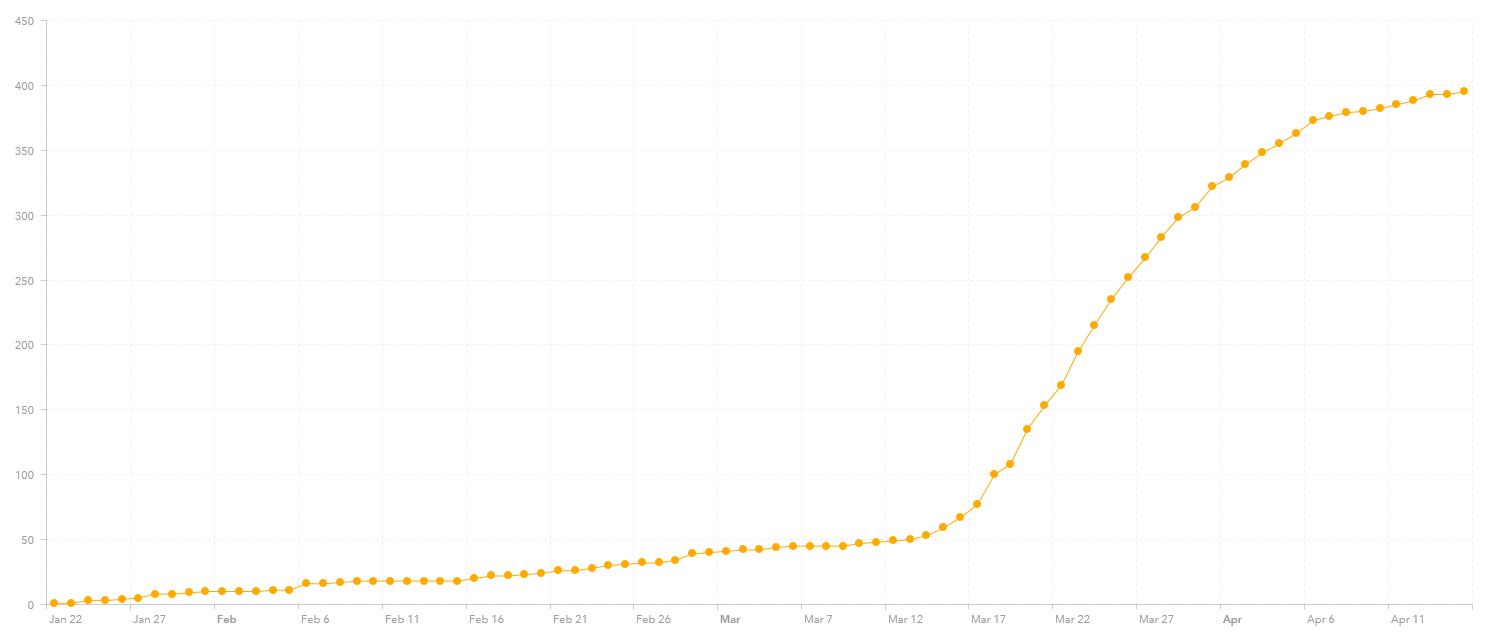
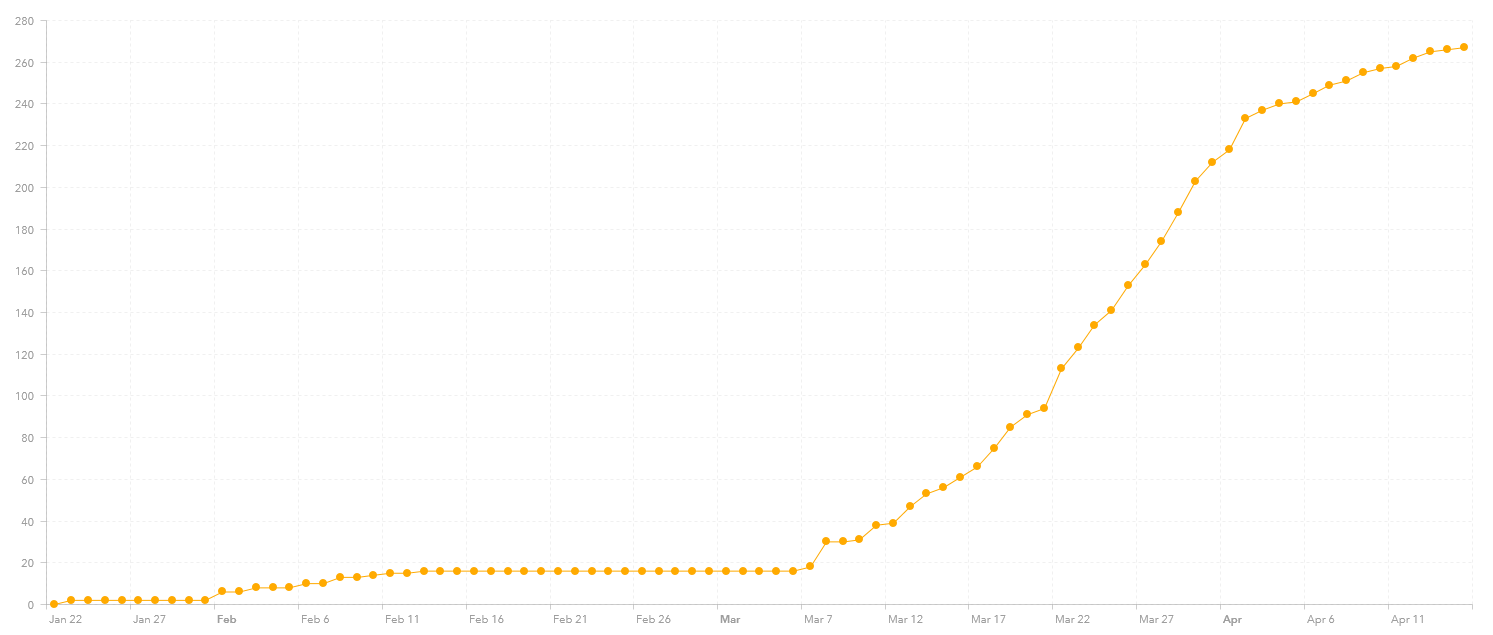
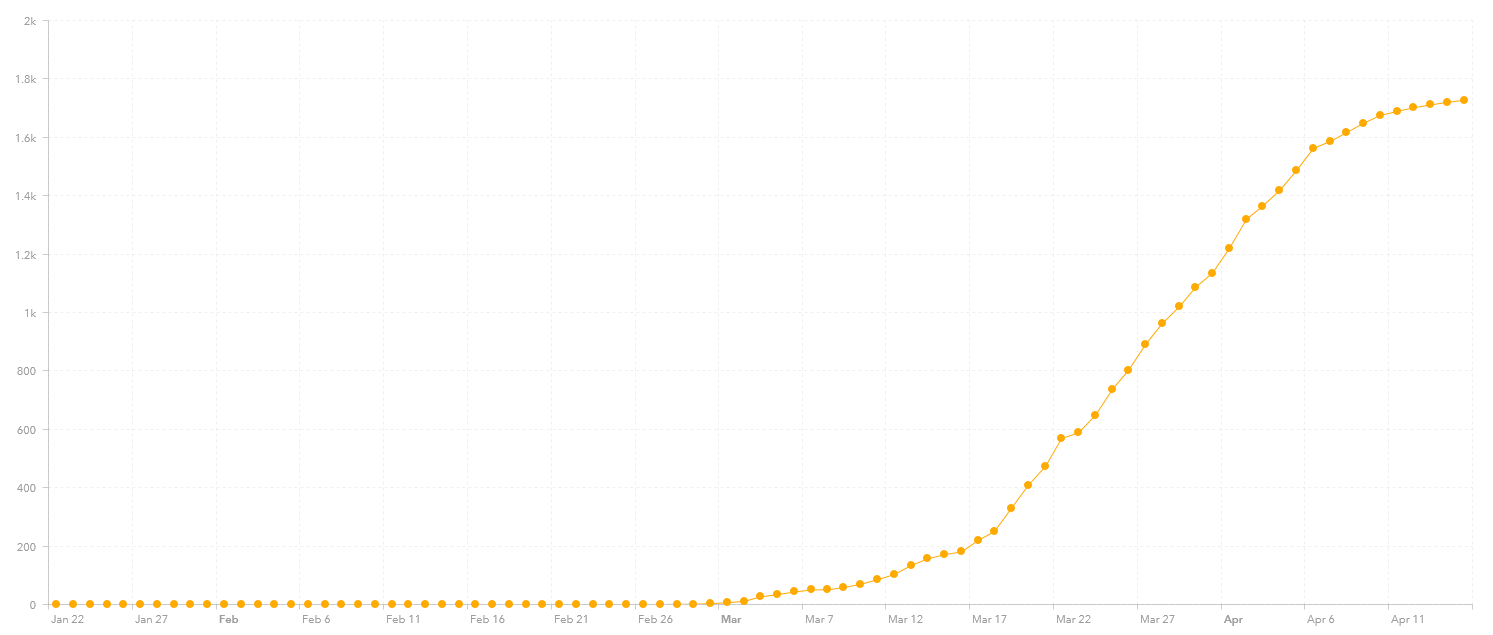
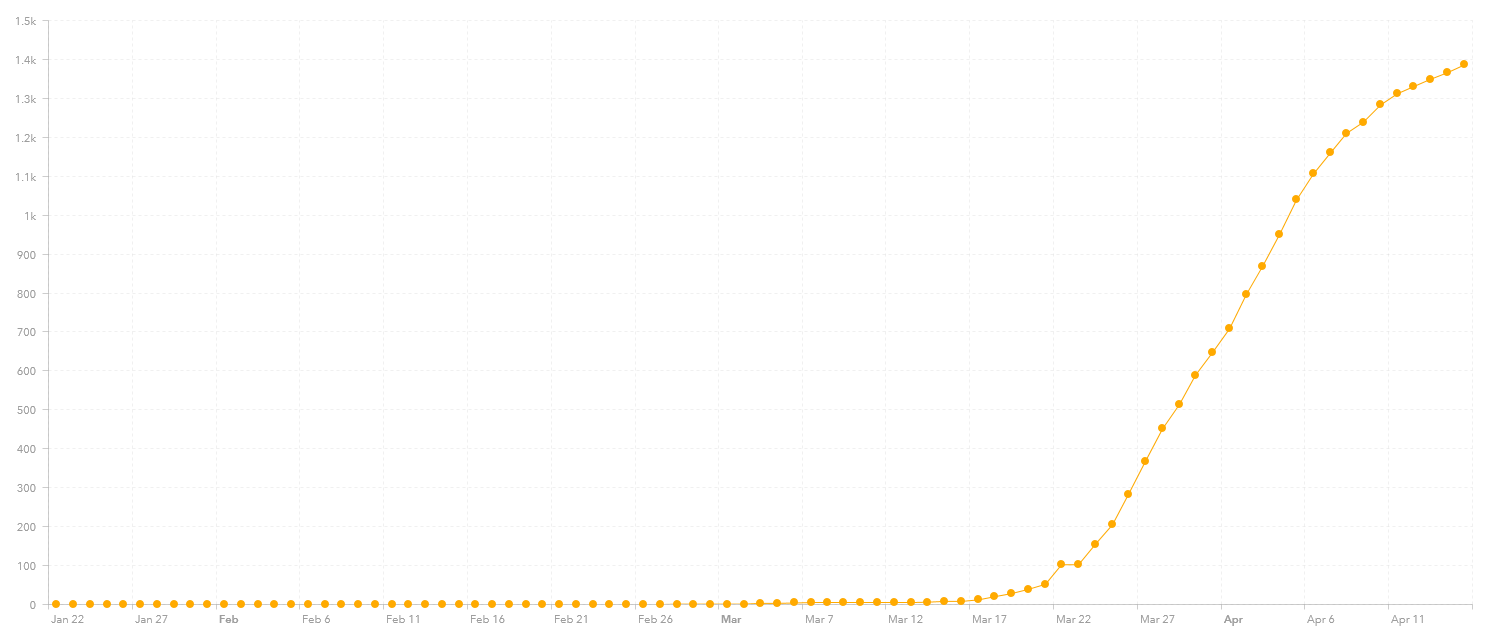
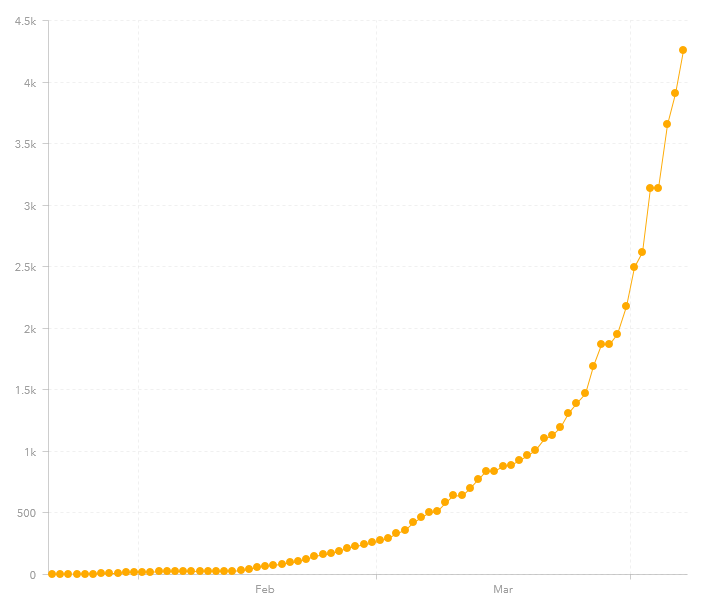
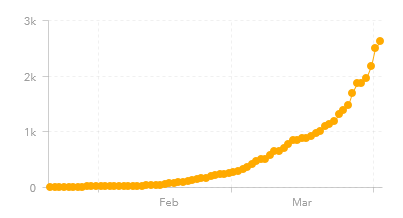
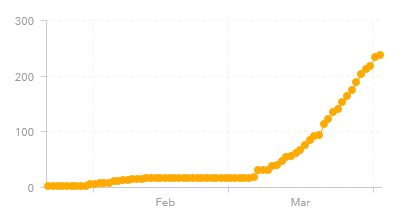
In contrast here are the graphs for three other East Asian nations, Japan (11,950 cases), Taiwan (427 cases) and Vietnam (268 cases, the same as last week). Not sure why Japan does not have the virus under control like South Korea does. This would be worth looking into.
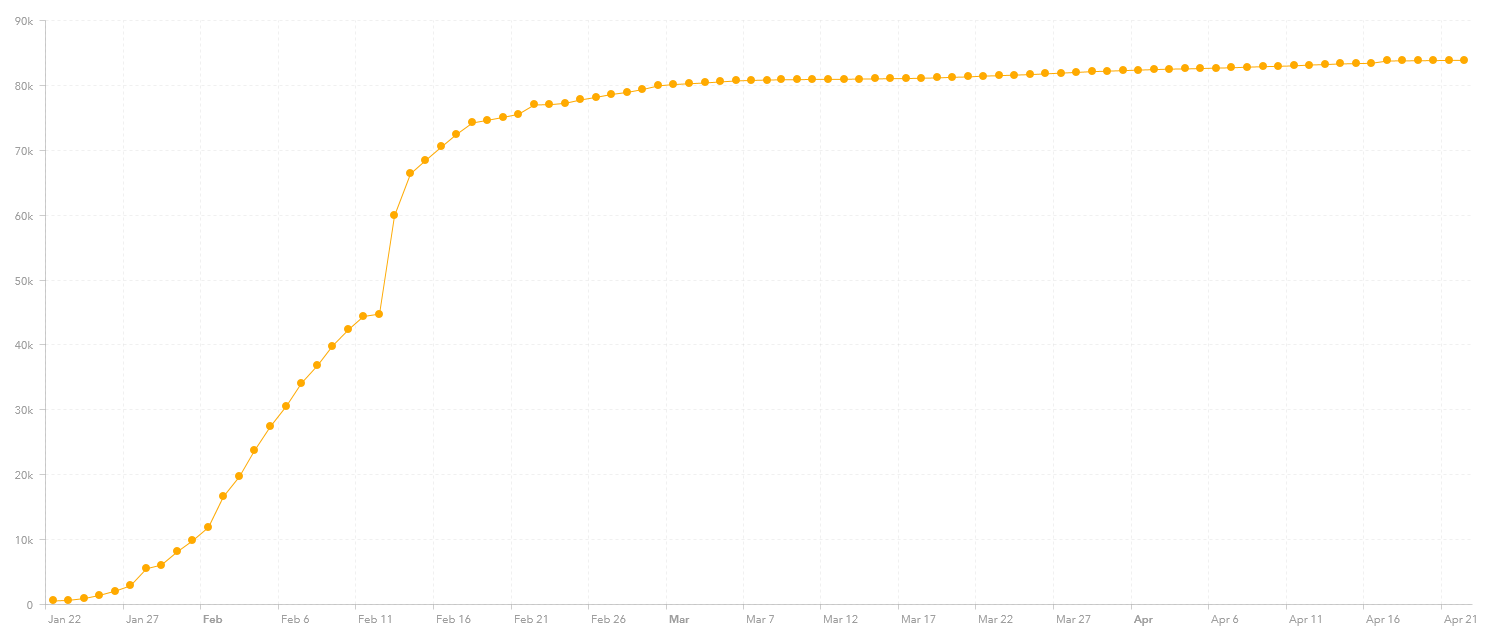
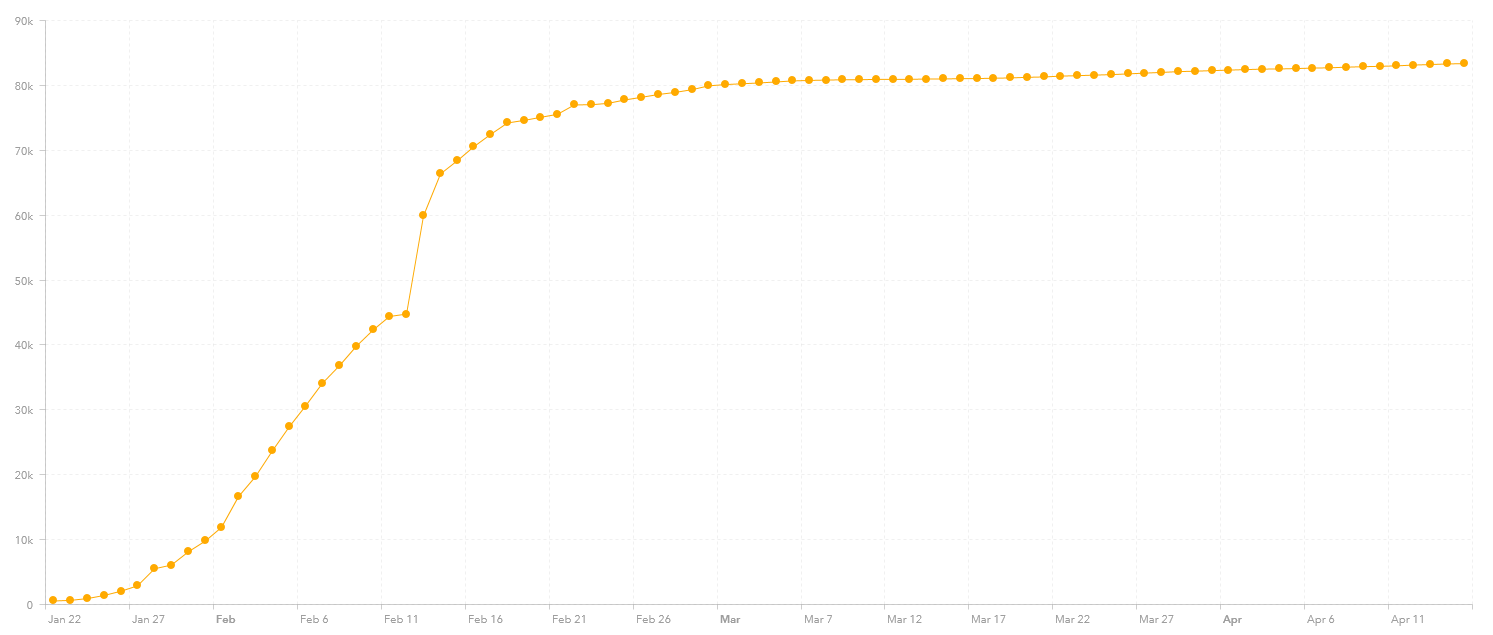
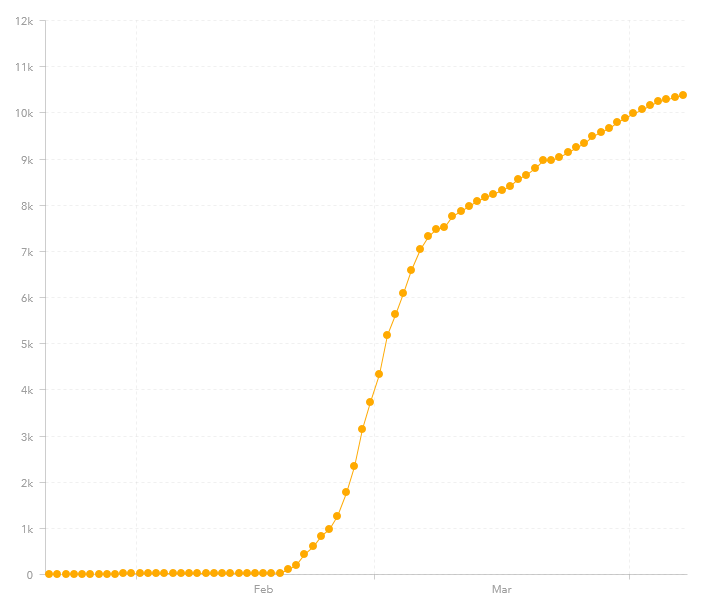
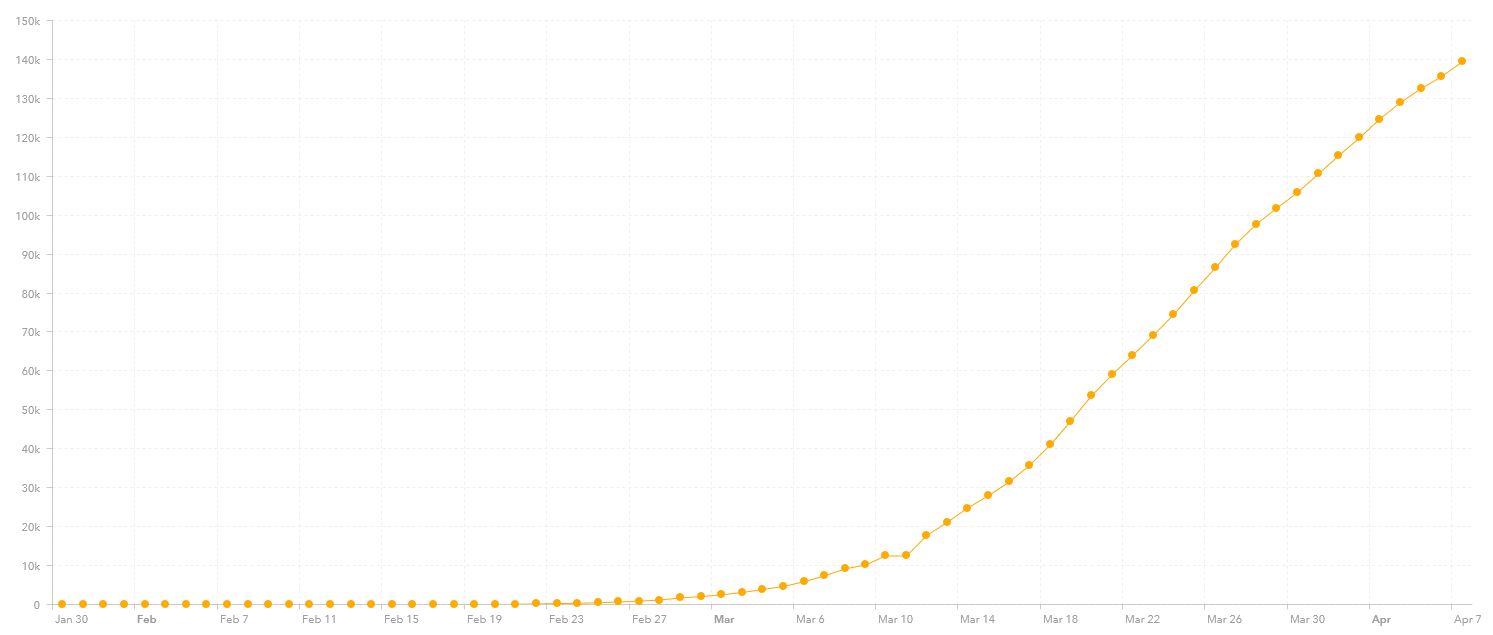
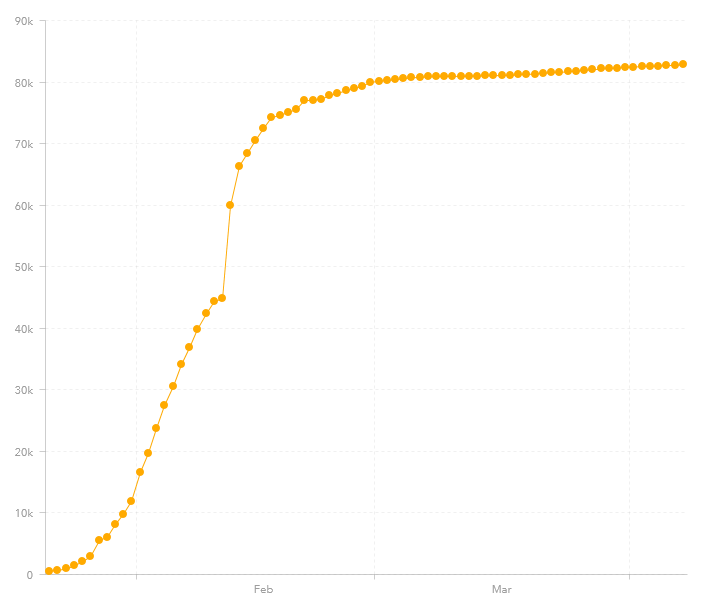
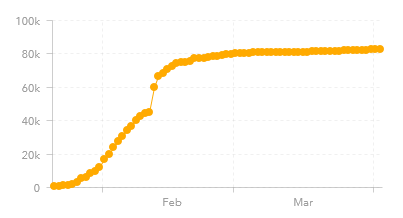
And here is China (83,878 reported cases), although there is still some concern about the accuracy of their statistics:
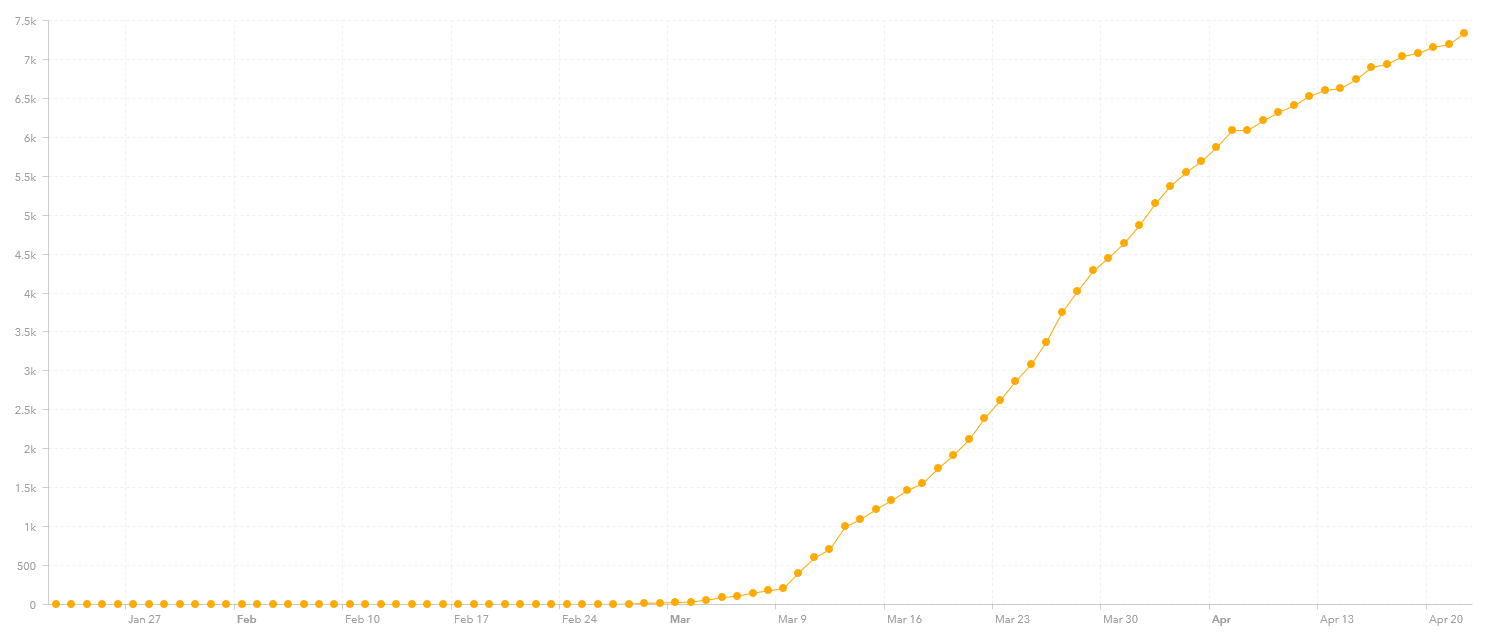
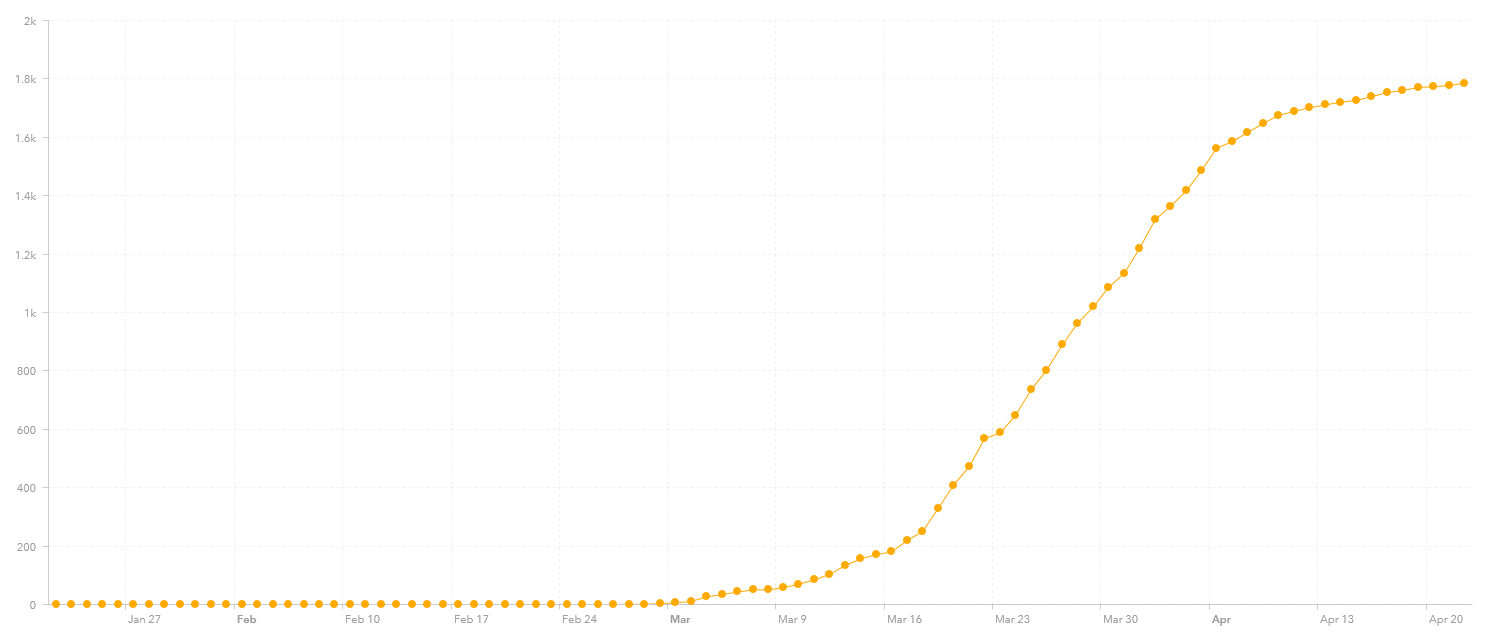
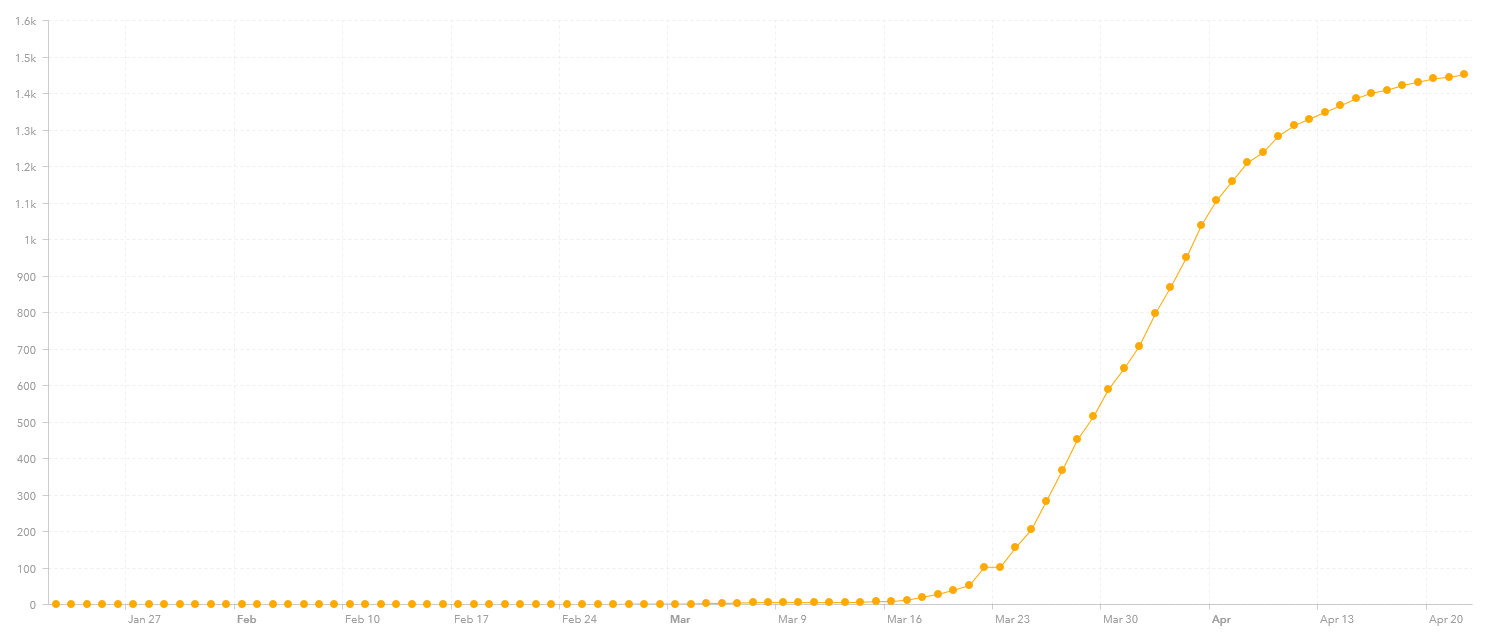
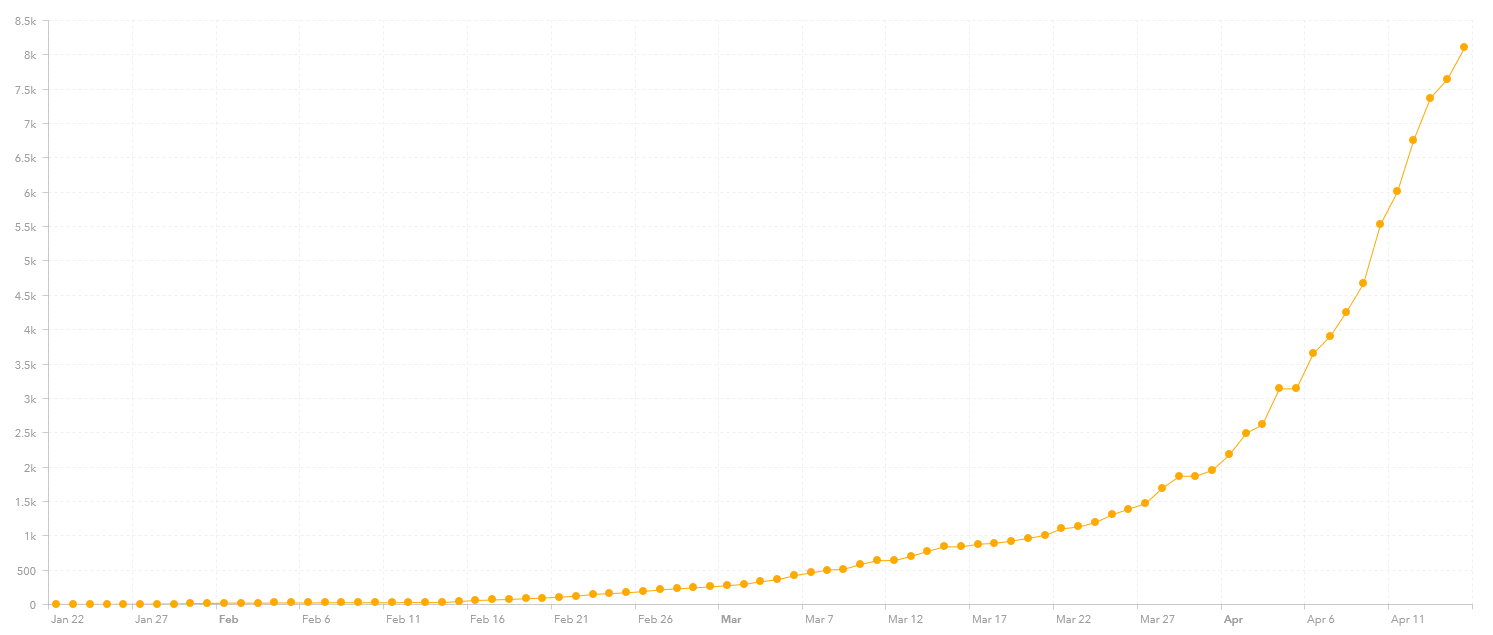
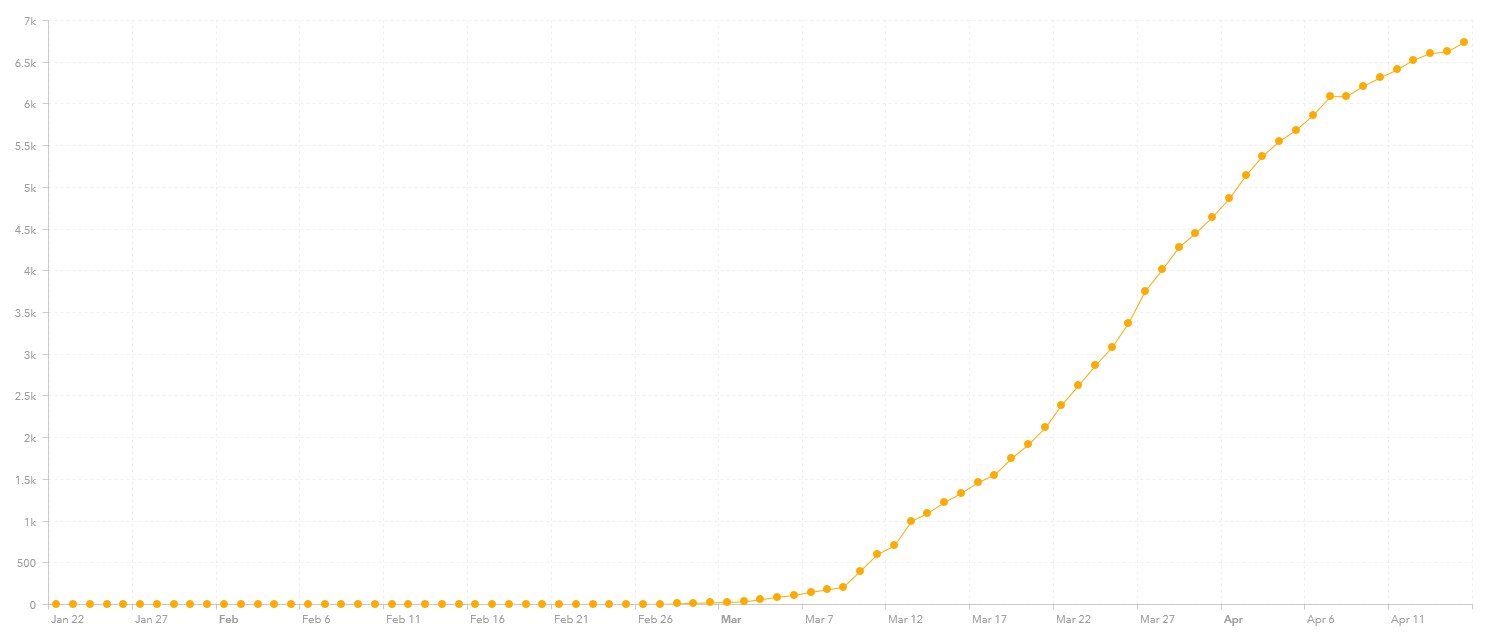
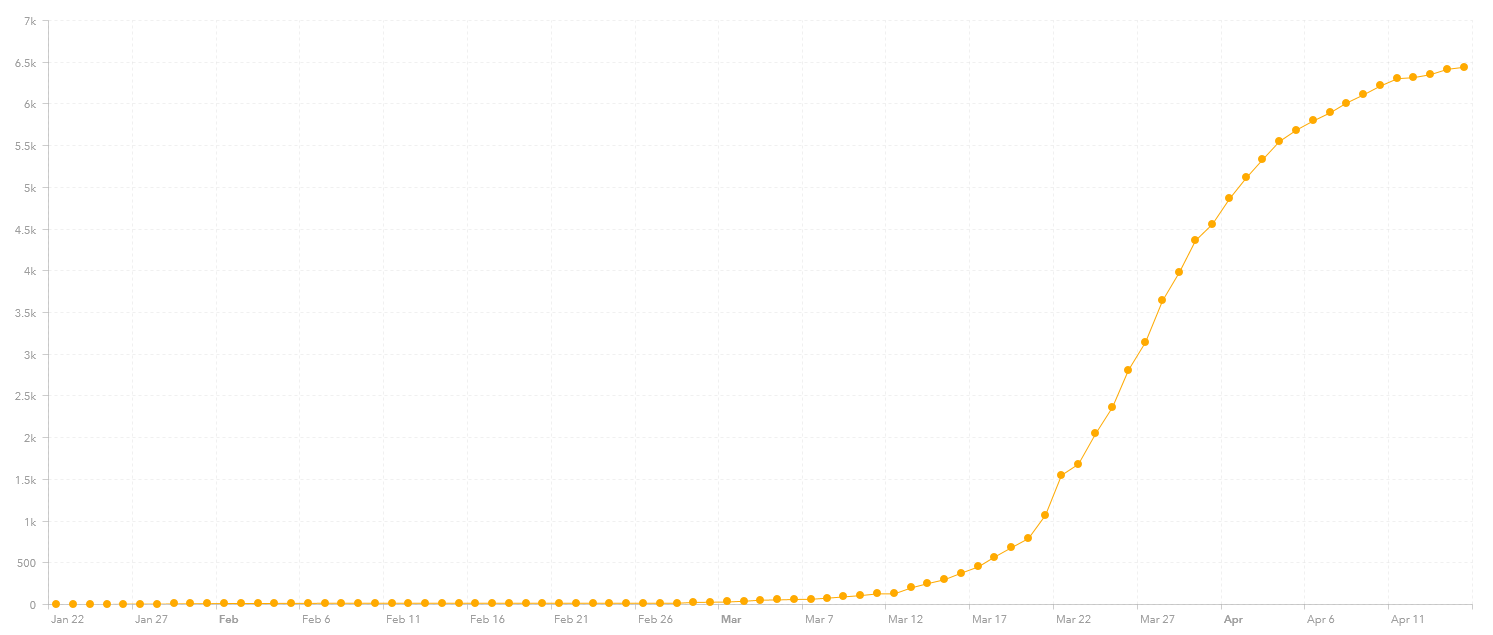
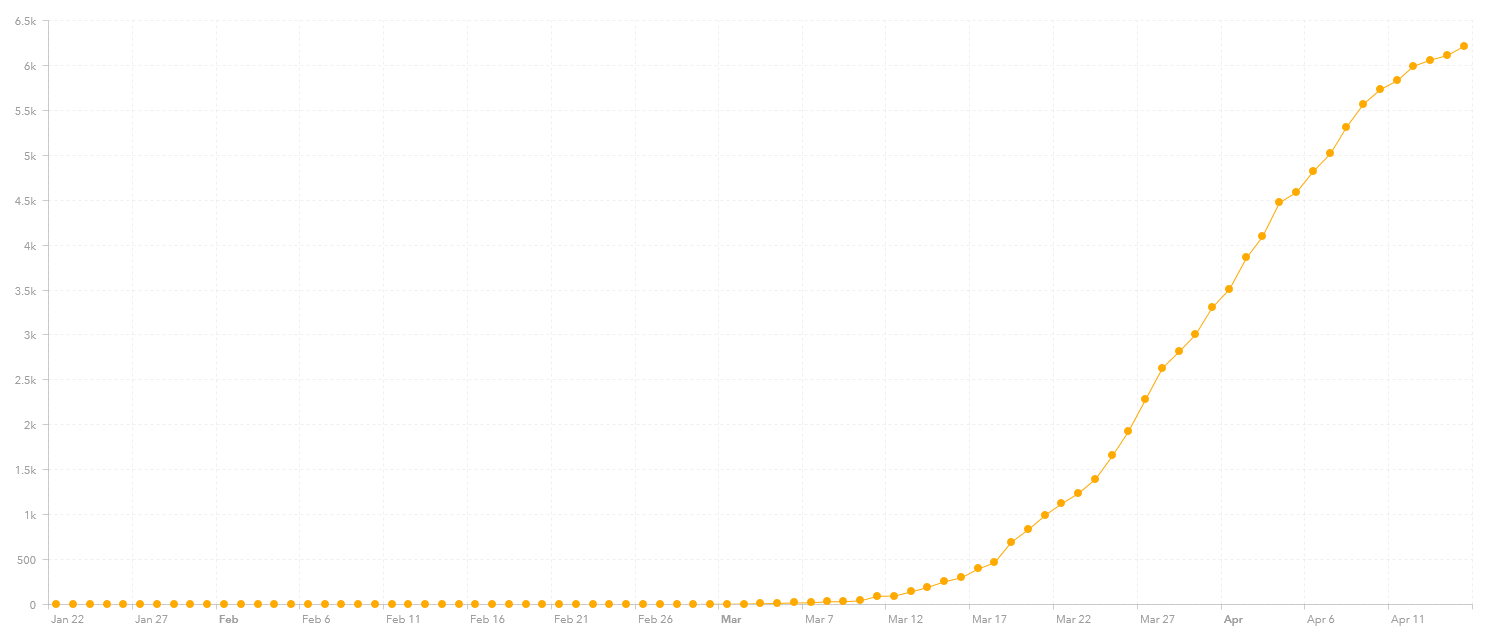
Finally, let me add the Austria (15,002 reported cases), Norway (7,338 reported cases), Australia (6,547 reported cases and only 85 new cases since last week), the Czech Republic (7,136 reported cases), Iceland (1,785 reported cases and only 58 new cases since last week) and New Zealand (1,451 reported cases and only 50 new cases since last week) to this collection of graphs as it appears that they are now reaching their inflection point and some have started leveling off:
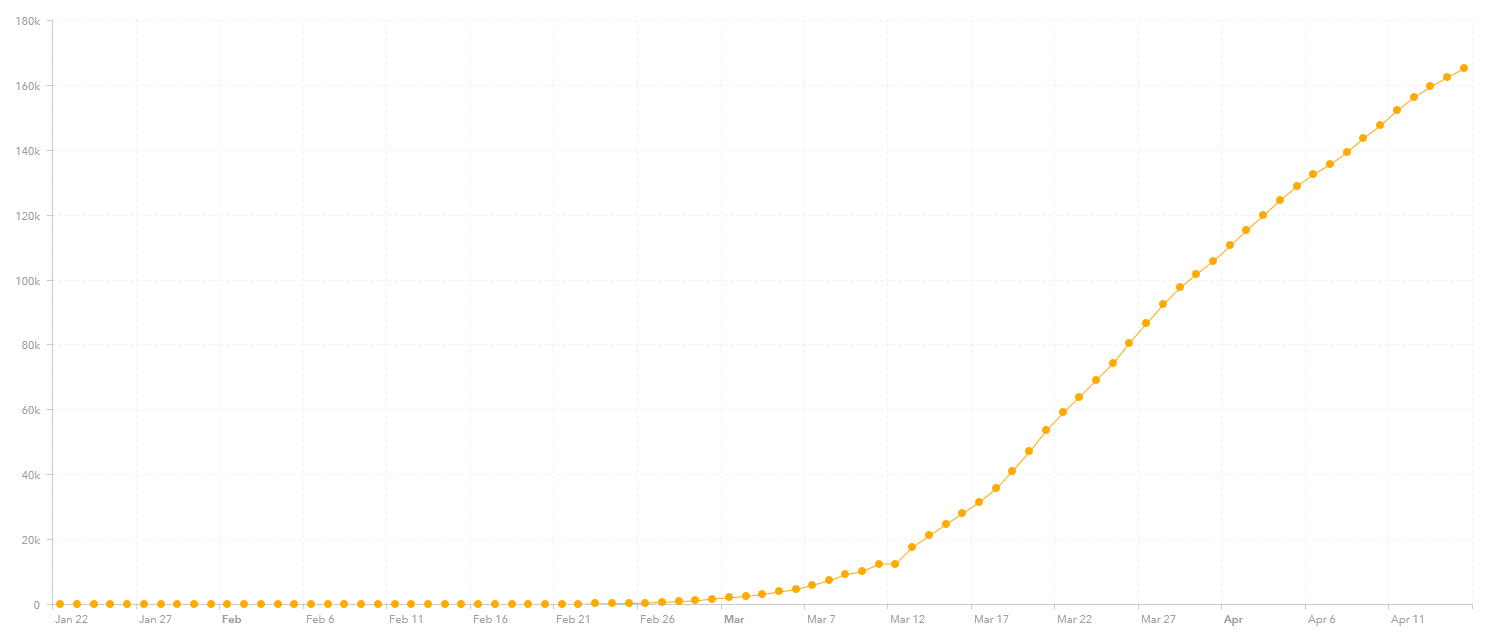
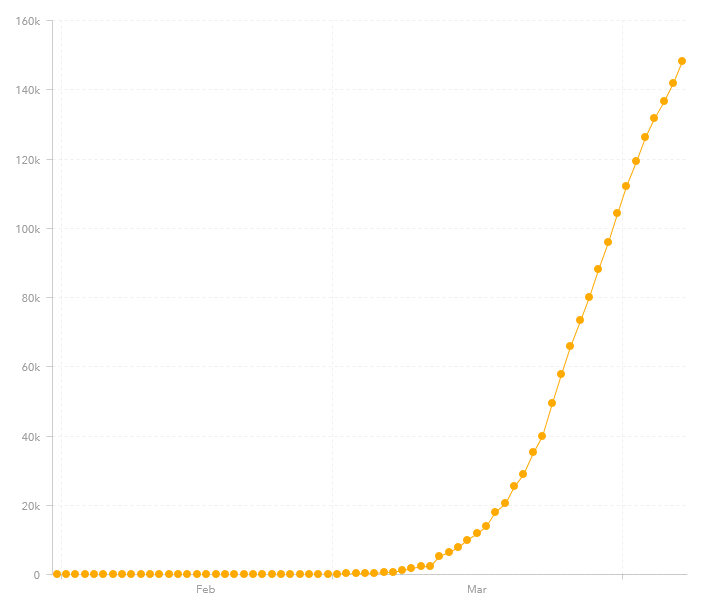
Finally, there is Germany, which has the fifth highest number of reported cases (at 150,773). They also appear to be bringing this under control.
And then there is Singapore. Last week it had 3,614 reported cases. Now it has 11,178 reported cases. It appears that they have lost control of the situation again.
Updating my posts for the last two weeks. This basically addresses the question of when is the virus mitigated, or even better when it is contained, and eventually when should restrictions be relaxed. So we look at South Korea compared to the three worst plagued countries in the world. We then look at three other countries in East Asia that were near China and had to deal with the virus sooner than most. We then look at a few other countries that appear to getting the virus under control. I think there is considerable value here in comparing results across several countries. All these are simple graphs pulled from the Johns Hopkins CSSE website as of 10:36:00 AM: Johns Hopkins CSSE
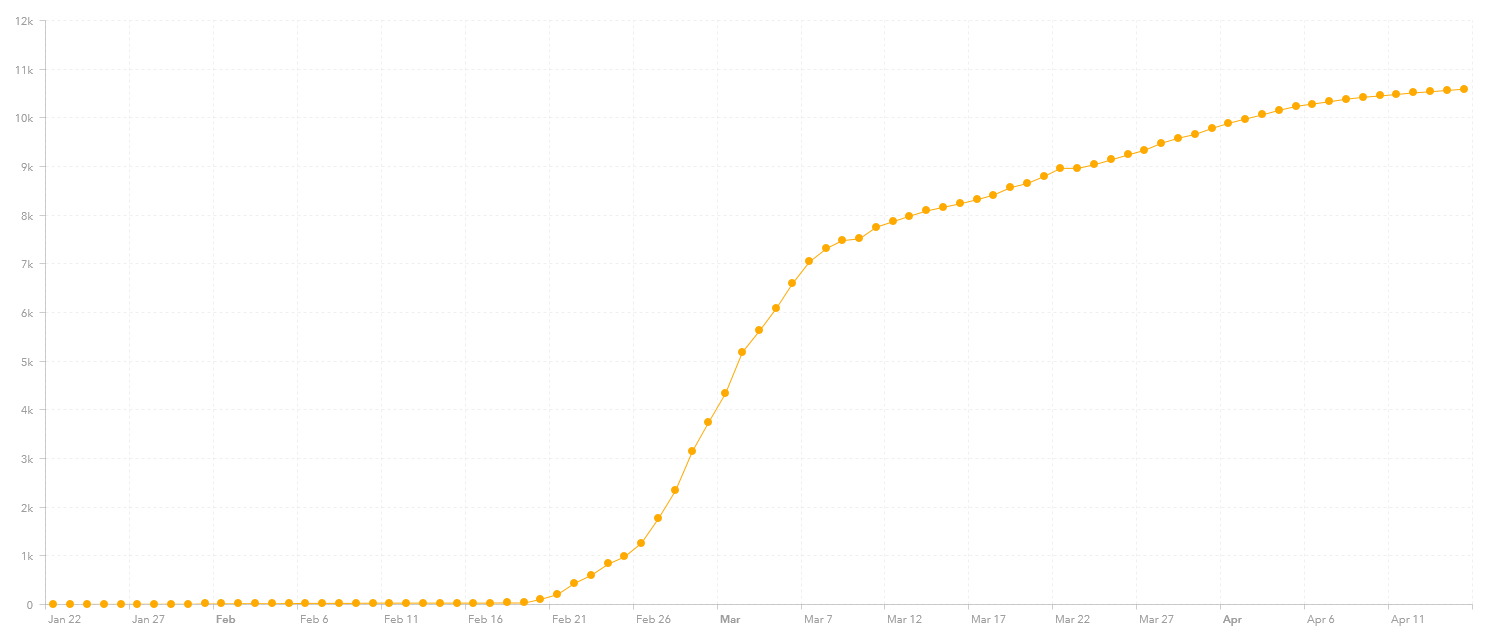
Here is the graph for the number of cases in South Korea (10,613 reported cases):
In comparison, here are the graphs for the United States (640,014 reported cases), Spain (182,816 reported cases) and Italy (165,155 reported cases). It looks like Spain and Italy are reaching their deflection point:
In contrast here are the graphs for three other East Asian nations, Japan, Taiwan and Vietnam. Note that they have fewer reported cases, 8,626, 395, 268 respectively:
And here is China (83,402 reported cases), although there is still some concern about the accuracy of their statistics:
Finally, let me add the Austria (14,451 reported cases), Norway (6,798 reported cases), Australia (6,462 reported cases), the Czech Republic (6,303 reported cases), Singapore (3,614 reported cases), Iceland (1,727 reported cases) and New Zealand (1,401 reported cases) to this collection of graphs as it appears that they are now reaching their inflection point and some have started leveling off:
South Korea, with an estimated 2020 population of 51,780,5798 million, has had 9,976 cases of coronavirus (as of 10:00:04 AM). They have tested more than 300,000 people and have had 169 deaths. Of those 9,976 cases, 5,828 are reported as recovered leaving them with 3,979 active cases. Outside of China, there are currently twelve countries with more cases than South Korea. They are United States (population 330 million), Italy ( 60 million), Spain (47 million), Germany (83 million), France, (67 million), Iran (83 million), United Kingdom (66 million), Switzerland, (9 million), Turkey (83 million), Netherlands (17 million) and Austria (9 million). Of those twelve countries, only Austria was less deaths than South Korea (although not per capita). There are an additional five countries with more deaths than South Korea (Belgium, Sweden, Brazil, Portugal and Indonesia). It is clear that South Korea has done a better job at containing the virus than at least 17 other countries.
This appears to be the case for many of the countries bordering China. Japan has 2,384 cases and 57 deaths (population 126 million), Taiwan has 339 cases and 5 deaths (population 23 million), and Vietnam has 227 cases and no reported deaths (population 96 million). Japan, South Korea and Taiwan are three of the five major trading partners of China (the others being the United States and the European Union). They are the closest to the source of the disease, were among the earliest to catch it, and yet they have certainly mitigated the results of the disease, and might even yet contain it. All three countries are democracies. Many other countries have had a longer warning period and do not seem to have done as well at containing the virus.
Is the difference leadership? Is the difference the responsive of the government and their health care system? What has South Korea, Japan, Taiwan and Vietnam done that the United States, Italy, Spain, Iran and so forth have not done?
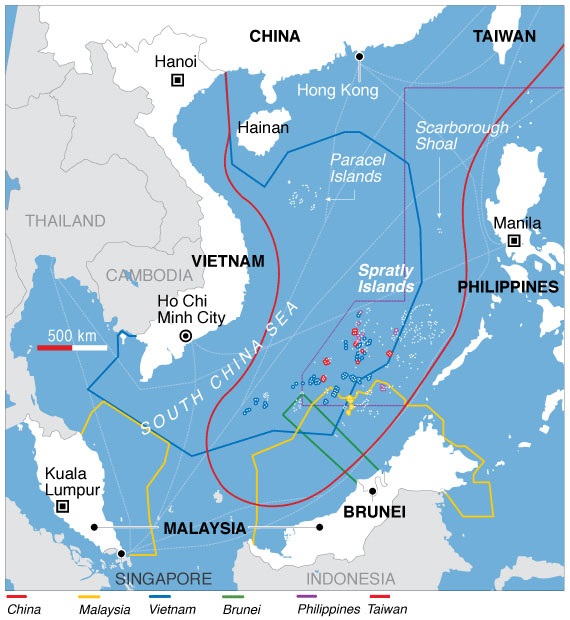
These has been a little rumbling lately in the news about Malaysia and Vietnam asserting their territorial rights in the South China Sea. Of course, part of the area they asserting is part of their 200 mile economic exclusion zone happens to be territory that Red China also claims. These are not the only countries that have such conflicts. Bordering the South China Sea is China, Taiwan, Philippines, Indonesia, Brunei, Singapore, Malaysia, Thailand, Cambodia and Vietnam. There countries with competing claims are China, Taiwan, Philippines, Indonesia, Brunei, Malaysia and Vietnam. Let us look at their naval assets for a moment.
China has the largest navy in the region. Their fleet (the People’s Liberation Army Navy) consists of:
2 new carriers – 54,500 to 58.600 tons (one commissioned in 2019)
36 Destroyers – 3,670 to 12,000 tons
52 Frigates – 2,000 to 4,200 tons
42 Corvettes – 1,400 tons
109 Missile boats – 170 to 520 tons
94 Submarine chasers
17 gunboats
20 mine countermeasures vessels – 400 to 1,200 tons
6 Amphibious transport docks (LPD) – 25,000 tons
1 Mobile Landing Platform
32 Landing Ship Tanks (LST) – 4,170 to 4,800 tons
31 Landing Ship medium (LSM) – 800 to 2,000 tons
7 Ballistic Missile Submarines (SSBN) – 8,000 to 11,500 tons
12 Nuclear attack Submarines (SSN) – 5,500 to 7,000 tons
55 Attack submarines (SSK) – 2,110 to 4,000 tons
The fleet also includes a 12 replenishment oilers and 232 various auxiliaries. The fleet is definitely growing and will have a third carrier around 2022.
The Taiwanese corvette is 567 tons, their patrol ships are 580 tons, their missile boats are 171 tonnes. The small Philippine fleet will get two frigates (2,600 tons) in 2020. Their corvette is 1,200 tons. Their offshore patrol vessels range from 712 to 3,250 tons. The patrol ships range from 140 to 357 tons, their patrol and missile boats are all less than 60 tons. The Indonesian ASW Corvettes 950 tons, East German built (we have a piano from East Germany).
There are some other countries on the periphery of this conflict, like Singapore, Thailand and Cambodia. We will address them in a subsequent post.
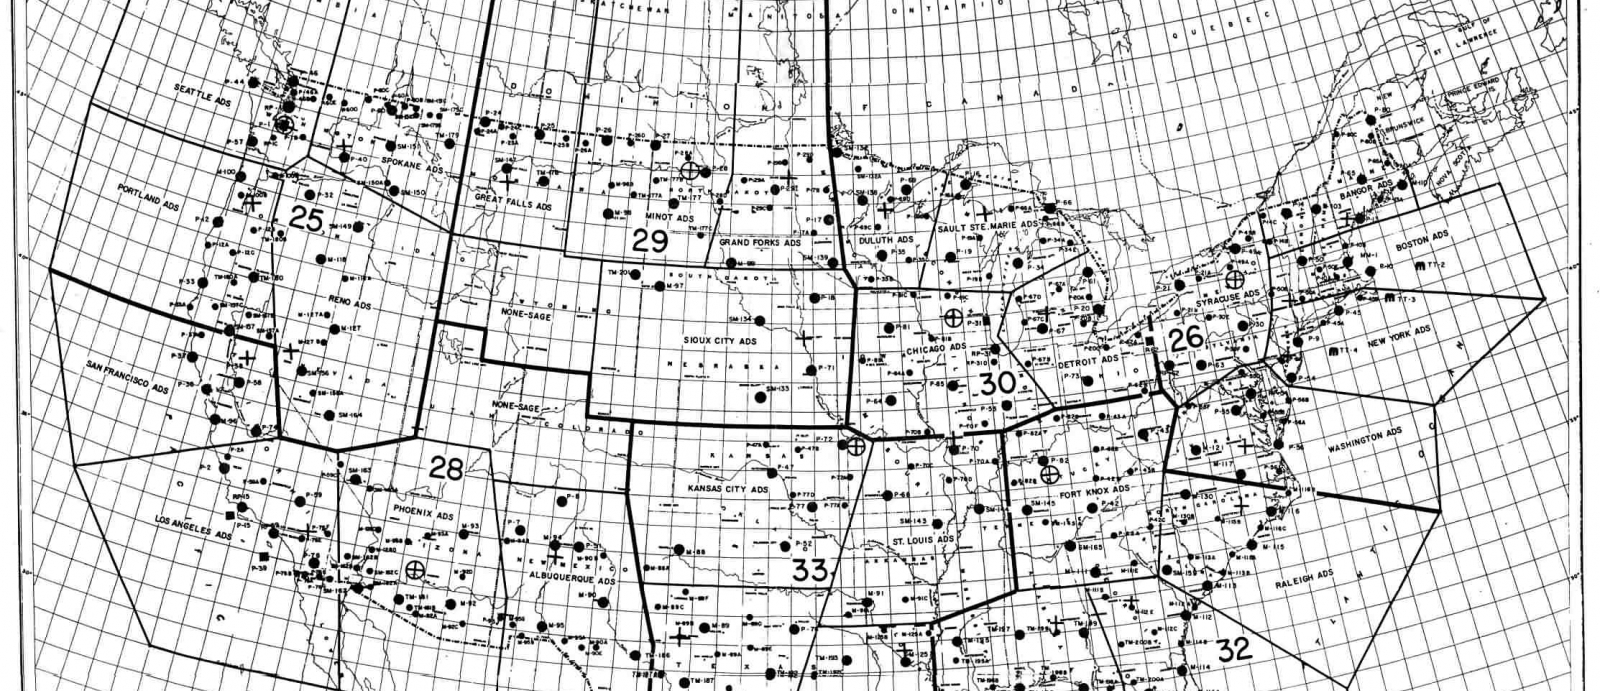
Continental U.S. Air Defense Identifications Zones [MIT Lincoln Laboratory]
My last post detailed how the outbreak of the Korean War in 1950 prompted the U.S. to undertake emergency efforts to bolster its continental air defenses, including the concept of the Air Defense Identification Zone (ADIZ). This post will trace the development of this network and its gradual integration with those of Japan and NATO.
The permanent network depended on each radar site to perform GCI [Ground Control & Intercept] functions or pass information to a nearby GCI center. For example, information gathered by North Truro Air Force Station on Cape Cod was transmitted via three dedicated land lines to the GCI center at Otis AFB, Massachusetts, and then on to the ADC Headquarters at Ent AFB, Colorado. The facility at Otis AFB was a regional information clearinghouse that integrated the data from North Truro and other regional radar stations, Navy picket ships, and the all-volunteer GOC [Ground Observer Corps]. The clearinghouse operation was labor intensive. The data had to be manually copied onto Plexiglas plotting boards. The ground controllers used this data to direct defensive fighters to their targets. It was a slow and cumbersome process, fraught with difficulties. Engagement information was passed on to command headquarters by telephone and teletype. At Ent AFB, the information received from the regional clearinghouses was then passed on to enlisted airmen standing on scaffolds behind the world’s largest Plexiglas board. Using grease pencils, these airmen etched the progress of enemy bombers onto the back of the Plexiglas board so that air defense commanders could evaluate and respond. This arrangement impeded rapid response to the air battle.
It is hard to imagine an air defense challenge of the magnitude that potentially faced the U.S. and USSR by 1955. The Strategic Air Command (SAC) bomber fleet peaked at over 2,500 in 1955-1965, with 2,000 B-47s (range of 2,013 statute miles) and 750 B-52s (range of 4,480 statute miles). The range of U.S. bombers was extended considerably by the ~800 KC-135 aerial re-fueling tanker aircraft fleet as well.
In spite of the much publicized “bomber gap,” taking Soviet production numbers (and liberally adding aircraft of shorter range or unavailable until 1962…) produces an approximate estimate for a Soviet bombing fleet:
M-4 “Bison” (range of 3480 statute miles) = 93
Tu-16 “Badger” (range of 3888 statute miles) = 1507
Tu-22 “Blinder” (range of 3000 statute miles) = 250-300
Tu-95 “Bear” (range of 9400 statute miles) = 300+
That gave the U.S. an advantage in bombers of 2,750 to ~2,200 over the Soviets. Now, imagine this air battle being conducted with manual tracking on plexiglass with grease pencils…untenable!
Air Defense and Modern Computing
However, the problem proved amenable to solutions provided by the pending computer revolution.
At the Lincoln Laboratory development continued on an automated command and control system centered around the 250-ton Whirlwind II (AN/FSQ-7) computer. Containing some 49,000 vacuum tubes, the Whirlwind II became a central component of the SAGE system. SAGE, a system of analog computer-equipped direction centers, processed information from ground radars, picket ships, early-warning aircraft, and ground observers onto a generated radarscope to create a composite picture of the emerging air battle. Gone were the Plexiglas TM boards and teletype reports. Having an instantaneous view of the air picture over North America, defense commanders would be able to quickly evaluate the threats and effectively deploy interceptors and missiles to meet the threat.
By 1954, with several more radars in the northeast providing data, the Cambridge control center (a prototype SAGE center) gained experience in directing F-86D interceptors against B-47 bombers performing mock raids. Still much development, research, and testing lay ahead. Bringing together long-range radar, communications, microwave electronics, and digital computer technologies required the largest research and development effort since the Manhattan Project. During its first ten years, the government spent $8 billion to develop and deploy SAGE. By 1958, Lincoln Laboratory had a professional staff of 720 with an annual budget of $22.5 million, to conduct SAGE-related work. The contract with IBM to build sixty production models of the Whirlwind II at $30 million each provided about half of the corporation’s revenues for the 1950s and exposed the corporation to technologies that it would use in the 1960s to dominate the computer industry. In the meantime, scientists and electronic engineers in the defense industry strove to install better radars and make these radars invulnerable to electronic countermeasures (ECM), commonly called jamming.
The SAGE development effort became one of the foundations of modern computing, giving IBM the technological capability to dominate for several decades, until it outsourced two key components: hardware to Intel and software to a young Microsoft, both of which became behemoths of the internet age. It is also estimated that this effort brought a price tag which exceeded that of the Manhattan Project. SAGE also transformed the attitude of the USAF towards technology and computerization.
Current Air Defense Networks
In the 1950s and 60s, the U.S. continental air defense network gradually began to expand geographically and integrate with NADGE and JADGE air defense networks of its NATO allies and Japan.
NATO Air Defense Ground Environment (NADGE): This was approved by NATO in December 1955, and became operational in 1962 with 18 radar stations. This eventually grew to 84 stations and provided an inter-connected network from Norway to Turkey before being superseded by the NATO Integrated Air Defense System (NATINADS) in 1972. NATINADS was further upgraded in the 1980s to include data from the E-3 Sentry AWACS aircraft (AEGIS (Airborne Early-warning/Ground Environment Integrated Segment); not to be confused with the USN system with the same acronym.)
Base Air Defense Ground Environment (BADGE): This was the automated system, in the same fashion as SAGE, which replaced the manual system in place with the JASDF since 1960. The requirement was stated in July 1961, and was actually modeled on the Naval Tactical Information System (NTDS), developed by Hughes for the US Navy. This was ordered in December 1964, and operational in March 1969. This was superseded by Japan Aerospace Defense Ground Environment (JADGE) in July 2009.
Air Defense Identification Zones (ADIZ) in the South China Sea [Maximilian Dörrbecker (Chumwa)/Creative Commons/Wikipedia]
My previous posts have discussed the Japanese Air Self Defense Force (JASDF) and the aircraft used to perform the Defensive Counter Air (DCA) mission. To accomplish this, the JASDF is supported by an extensive air defense system which closely mirrors U.S. Air Force (USAF) and U.S. Navy (USN) systems and has co-evolved as technology and threats have changed over time.
On June 25, 1950, North Korea launched an invasion of South Korea, drawing the United States into a war that would last for three years. Believing that the North Korean attack could represent the first phase of a Soviet-inspired general war, the Joint Chiefs of Staff ordered Air Force air defense forces to a special alert status. In the process of placing forces on heightened alert, the Air Force uncovered major weaknesses in the coordination of defensive units to defend the nation’s airspace. As a result, an air defense command and control structure began to develop and Air Defense Identification Zones (ADIZ) were staked out along the nation’s frontiers. With the establishment of ADIZ, unidentified aircraft approaching North American airspace would be interrogated by radio. If the radio interrogation failed to identify the aircraft, the Air Force launched interceptor aircraft to identify the intruder visually. In addition, the Air Force received Army cooperation. The commander of the Army’s Antiaircraft Artillery Command allowed the Air Force to take operational control of the gun batteries as part of a coordinated defense in the event of attack.
In addition to North America, the U.S. unilaterally declared ADIZs to protect Japan, South Korea, the Philippines, and Taiwan in 1950. This action had no explicit foundation in international law.
Under the Convention on International Civil Aviation (the Chicago Convention), each State has complete and exclusive sovereignty over the airspace above its territory. While national sovereignty cannot be delegated, the responsibility for the provision of air traffic services can be delegated.… [A] State which delegates to another State the responsibility for providing air traffic services within airspace over its territory does so without derogation of its sovereignty.
This precedent set the stage for China to unilaterally declare ADIZs its own in 2013 that overlap those of Japan in the East China Sea. China’s ADIZs have the same international legal validity as those of the U.S. and Japan, which has muted criticism of China’s actions by those countries.
Recent activity by the Chinese People’s Liberation Army Air Force (PLAAF) and nuclear and missile testing by the Democratic People’s Republic of Korea (DPRK, or North Korea) is prompting incremental upgrades and improvements to the Japanese air defense radar network.
In August 2018, six Chinese H-6 bombers passed between Okinawa’s main island and Miyako Island heading north to Kii Peninsula. “The activities by Chinese aircraft in surrounding areas of our country have become more active and expanding its area of operation,” the spokesman [of the Japanese Ministry of Defense] said.… “There were no units placed on the islands on the Pacific Ocean side, such as Ogasawara islands, which conducted monitoring of the area…and the area was without an air defense capability.”
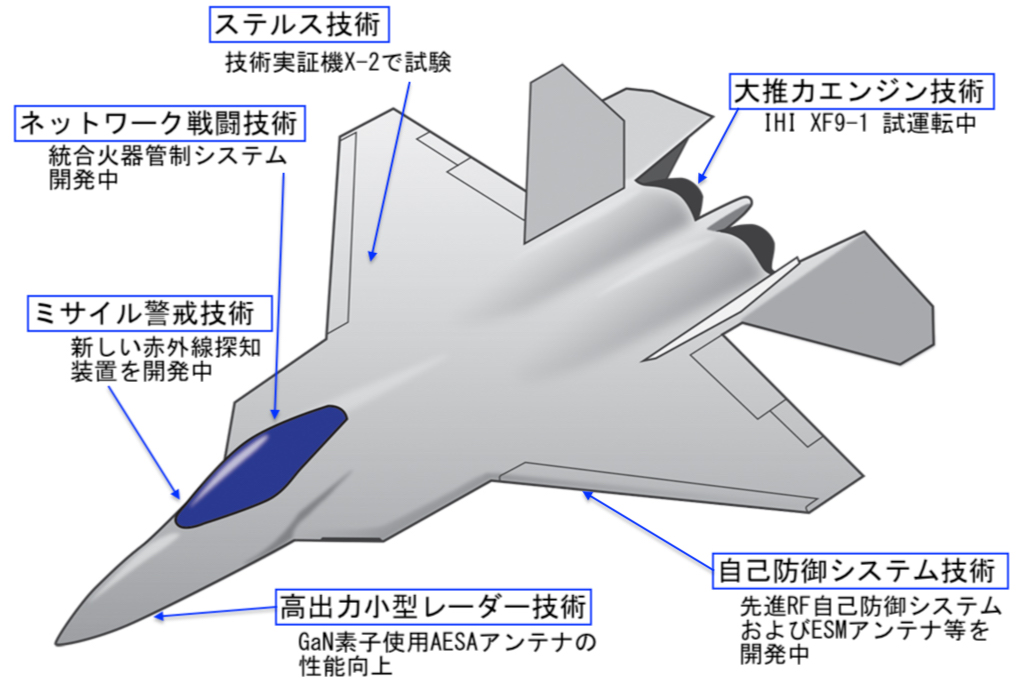
A schematic rendering of Japan’s proposed F-3 fighter [Tokyoexpress.info]
In my previous post, I discussed the progression of aircraft in use by the Japanese Air Self Defense Force (JASDF) since World War II. Japan has also invested significant sums in its domestic aerospace manufacturing capability over this same time period.
Japanese aircraft manufacturing has long been closely tied to the U.S Air Force (USAF) and U.S. aerospace majors offering aircraft for sales, as well as licensed production. Japanese aerospace trade groups categorize this into several distinct phases, including:
Restarting the aircraft business – starting in 1952 during the Korean War, Japanese aerospace firms like Mitsubishi and Kawasaki reacquired aircraft manufacturing capability by securing contacts with the USAF for maintenance, repair and overhaul (MRO) of damaged USAF aircraft, including the F-86 Sabre, considered by the Americans to be the star aircraft of the war (although many believe its opponent from the Soviet side, the MiG-15 to have been superior.) There was little doubt, then, that the JASDF would purchase the F-86 and then license its domestic production.
Licensed production of US military aircraft – “Japan has engaged in licensed production of U.S. state-of-the-art fighter planes, from the F-86 to the F-104, the F-4, and the F-15. Through these projects, the Japanese aircraft industry revived the technical capabilities necessary to domestically manufacture entire aircraft.”
Domestic military aircraft production – Japanese designed aircraft, while independent, unique designs, also leveraged certain Western designed aircraft as their inspiration, such as the T-1 and eventual F-1 follow-on and the clear resemblance to the British Jaguar. This pattern was repeated in 1987 with the F-2 and its clear design basis on the F-16.
Domestic Production of business, and civil aircraft – “Japan domestically produces the YS-11 passenger plane as well as the FA-200, MU-2, FA-300, MU-300, BK-117, and other commercial aircraft, and is an active participant in international joint development programs with partners such as the American passenger aircraft manufacturer Boeing.”
Mitsubishi Heavy Industries (MHI) won a contract to build the wing for the Boeing 787, a job that Boeing now considers a core competency, and is unlikely to outsource again (they kept this task in house for the more recent 737 MAX, and 777X aircraft). This shows MHI’s depth of capability.
Also in the previous post, I could not help but include the “F-22J,” a hypothetical fighter that has been requested by the Japanese government numerous times, as the air power threat from the Chinese People’s Liberation Army Air Force (PLAAF) has grown. The export of the F-22, however, was outlawed by the Obey amendment to the 1998 Defense Authorization Act (a useful summary of this debate is here). So stymied, the JASDF and supporting Ministry of Defense personnel conducted a series of design studies in order to establish detailed requirements. These studies clarified the approach to be taken for the next aircraft to put into service, the F-3 program, ostensibly a successor to the F-2, although the role to be played is more of an air superiority or air dominance fighter, rather than a strike fighter. These studies concluded that range, or endurance is the most important metric for survivability, a very interesting result indeed.
Airframe developers…appear to have settled on something close to the 2013 configuration for the F-3 that emphasized endurance and weapons load over flight performance… That design, 25DMU, described a heavy fighter with a belly weapons bay for six ramjet missiles about the size of the MBDA Meteor. The wing was large and slender by fighter standards, offering high fuel volume and low drag due to lift but penalizing acceleration.… The key factor was that the high-endurance design provided more aircraft on station than would be available from an alternative fleet of high-performance fighters. – (Aviation Week & Space Technology, February 15-28, 2016)
I am curious about the air combat models that reached the conclusion that endurance is the key metric for a new fighter. Similar USAF combat models indicated that in a conflict with PLA armed forces, the USAF would be pushed back to their bases in Japan after the first few days. “In any air war we do great in the first couple of days. Then we have to move everything back to Japan, and we can’t generate sufficient sorties from that point for deep strike on the mainland,” according to Christopher Johnson, former CIA senior China analyst [“The rivals,” The Economist, 20 October 2018]. (History reminds us of aircraft designed for range and maneuverability, the Mitsubishi A6M “Zero,” which also de-emphasized durability, such as pilot armor or self-sealing fuel tanks … was this the best choice?) Validation of combat models with historical combat data seems like an excellent choice if you are investing trillions of Yen, putting the lives of your military pilots on the line, and investing in a platform that will be in service for decades.
Given this expected cost, Japan faces a choice to develop the F-3 independently, or with foreign partners. Mitsubishi built and flew the X-2 “Shinshin” prototype in April 2016. The JASDF also issued an RFP to existing aircraft manufacturers, including the BAE Eurofighter Typhoon, the Boeing F-15 Eagle, and the Lockheed Martin F-22 Raptor. In October 2018, the Typhoon and the Eagle were rejected for not meeting the requirements, while the Raptor was rejected because “no clear explanation was given about the possibility of the U.S. government lifting the export ban.” The prospect of funding the entire cost of the F-3 fighter by independently developing the X-2 also does not appear acceptable, so Japan will look for a foreign partner for co-development. There is no shortage of options, from the British, the Franco-Germans, or multiple options with the Americans.


#/media/File:JADIZ_and_CADIZ_and_KADIZ_in_East_China_Sea.jpg)