Category Dupuy’s Theory of Combat

Advance Rates in Combat

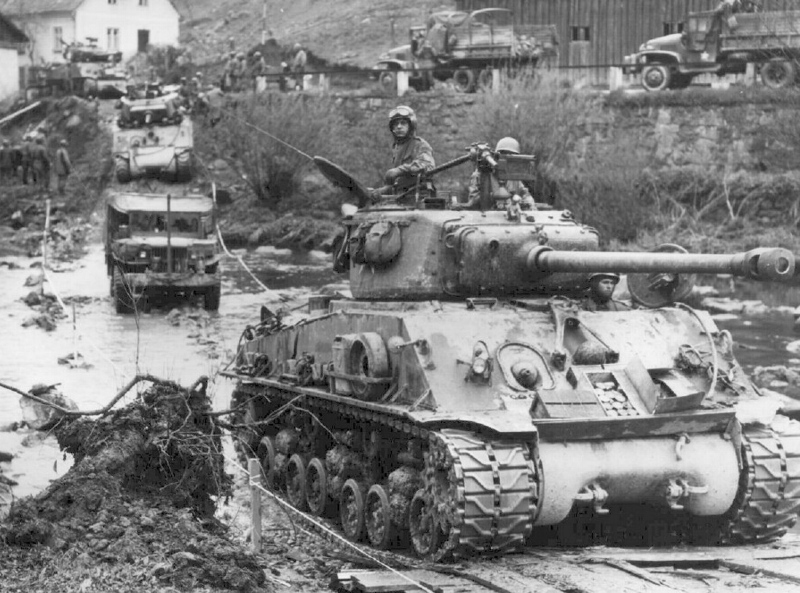
M4A3E2

Advance Rates in Combat:

                Units maneuver before and during a battle to achieve a more favorable position. This maneuver is often unopposed and is not the subject of this discussion. Unopposed movement before combat is often quite fast, although often not as fast as people would like to assume. Once engaged with an opposing force, the front line between them also moves, usually moving forwards if the attacker is winning and moving backwards for the defender if he is losing or choosing to withdraw. These are opposed advance rates. This section is focused on discussing opposed advance rates or “advance rates in combat.”

            The operations research and combat modeling community have often taken a short-hand step of predicting advance rates in combat based upon force ratios, so that a force with a three-to-one force ratio advances faster than a force with a two-to-one force ratio. But, there is not a direct relationship between force ratios and advance rates. There is an indirect relationship between them, in that higher forces ratios increased the chances of winning, and winning the combat and the degree of victory helps increase advance rates. There is little analytical work that has been done on this subject.[1]

            Opposed advance rates are very much influenced by 1) terrain, 2) weather and 3) the degree of mechanization and mobilization, in addition to 4) the degree of enemy opposition. These four factors all influence what the rates will be.

            In a study The Dupuy Institute did on enemy prisoner of war capture rates, we ended up coding a series of engagements by outcome. This has proven to a useful coding for the examination of advance rates. Engagements codes as outcomes I and II (limited action and limited attack) are not of concern for this discussion. The engagement coded as attack fails (outcome III) is significant, as these are cases where the attacker is determined to have failed. As such they often do not advance at all, sometimes have a very limited advance and sometimes are even pushed back (have a negative advance). For example, in our work on the subject, of our 271 division-level engagements from Western Europe 1943-45 the average advance rate was 1.81 kilometers per day. For Eastern Europe in 1943 the average advance rate was 4.54 kilometers per day based upon 173 division-level engagements.[2] These advance rates are irrespective of what the force ratios are for an engagement.

            In contrast, in those engagements where the attacker is determined to have won and is coded as attacker advances (outcome IV) the attacker advances an average of 2.00 kilometers in the 142 engagements from Western Europe 1943-45. The average force ratio of these engagements was 2.17. In the case of Eastern Europe in 1943, the average advance rate was 5.80 kilometers based upon 73 engagements. The average force ratio of these engagements was 1.62.

            We also coded engagements where the defender was penetrated (outcome V). These are those cases where the attacker penetrated the main defensive line of the defending unit, forcing them to either withdraw, reposition or counterattack. This penetration is achieved by either overwhelming combat power, the end result of an extended operation that finally pushes through the defenses, or a gap in the defensive line usually as a result of a mistake. Superior mechanization or mobility for the attacker can also make a difference. In those engagements where the defender was determined to have been penetrated the attacker advanced an average of 4.12 kilometers in 34 engagements from Western Europe 1943-45. The average force ratio of these engagements was 2.31. In the case of Eastern Europe in 1943, the average advance rates was 11.28 kilometers based upon 19 engagements. The average force ratio of these engagements was 1.99.

            This clearly shows the difference in advance rate based upon outcome. It is only related to force ratios to the extant the force ratios are related to producing these different outcomes.


            Also of significance is terrain and weather. Needless to say, significant blocking obstacles like bodies of water, can halt an advance and various rivers and creeks often considerably slow them, even with engineering and bridging support. Rugged terrain is more difficult to advance through and easier to defend and delay then smoother terrain. Closed or wooded terrain is more difficult to advance through and easier to defend and delay then open terrain. Urban terrain tends to also slow down advance rates, being effectively “closed terrain.” If it is raining then advance rates are slower than in clear weather. Sometimes considerably slower in heavy rain. The season it is, which does influence the amount of daylight, also affects the advance rate. Units move faster in daylight than in darkness. This is all heavily influenced by the road network and the number of roads in the area of advance.

            No systematic study of advance rates has been done by the operations research community. Probably the most developed discussion of the subject was the material assembled for the combat models developed by Trevor Dupuy. This included addressing the effects of terrain and weather and road network on the advance rates. A combat model is an imperfect theory of combat.

            Even though this combat modeling effort is far from perfect and fundamentally based upon quantifying factors derived by professional judgment, tables derived from this modeling effort have become standard presentations in a couple of U.S. Army and USMC planning and reference manuals. This includes U.S. Army Staff Reference Guide and the Marine Corps’ MAGTF Planner’s Reference Manual.[3]

The original table, from Numbers, Predictions and War, is here:[4]


STANDARD (UNMODIFIED) ADVANCE RATES


                                                                                    Rates in km/day

                                                Armored          Mechzd.          Infantry           Horse Cavalry

                                                Division           Division           Division           Division or

                                                                                                or Force           Force

Against Intense Resistance

    (P/P: 1.0-1.1O)

Hasty defense/delay                4.0                   4.0                   4.0                   3.0

Prepared defense                    2.0                   2.0                   2.0                   1.6

Fortified defense                     1.0                   1.0                   1.0                   0.6


 Against Strong/Intense Resistance

    (P/P: 1-11-125)

Hasty defense/delay                5.0                   4.5                   4.5                   3.5

Prepared defense                    2.25                 2.25                 2.25                 1.5

Fortified defense                     1.25                 1.25                 1.25                 0.7


Against Strong Defense

    (P/P: 1.26-1.45)

Hasty defense/delay                6.0                   5.0                   5.0                   4.0

Prepared defense                    2.5                   2.5                   2.5                   2.0

Fortified defense                     1.5                   1.5                   1.5                   0.8


Against Moderate/Strong Resistance

    (P/P: 1.46-1.75)

Hasty defense                         9.0                   7.5                   6.5                   6.0

Prepared defense                    4.0                   3.5                   3.0                   2.5

Fortified defense                     2.0                   2.0                   1.75                 0.9


Against Moderate Resistance

    (P/P: 1.76-225)

Hasty defense/delay                12.0                 10.0                 8.0                   8.0

Prepared defense                    6.0                   5.0                   4.0                   3.0

Fortified defense                     3.0                   2.5                   2.0                   1.0


Against Slight/Moderate Resistance

    (P/P:2.26-3.0)

Hasty defense/delay                16.0                 13.0                 10.0                 12.0

Prepared defense                    8.0                   7.0                   5.0                   6.0

Fortified defense                     4.0                   3.0                   2.5                   2.0


Against Slight Resistance

    (P/P: 3.01-4.25)

Hasty defense/delay                20.0                 16.0                 12.0                 15.0

Prepared defense                    10.0                 8.0                   6.0                   7.0

Fortified defense                     5.0                   4.0                   3.0                   4.0


Against Negligible/Slight Resistance

    (P/P:4.26-6.00)

Hasty defense/delay                40.0                 30.0                 18.0                 28.0

Prepared defense                    20.0                 16.0                 10.0                 14.0

Fortified defense                     10.0                 8.0                   6.0                   7.0


Against Negligible Resistance

    (P/P: 6.00 plus)

Hasty defense /delay               60.0                 48.0                 24.0                 40.0

Prepared/fortified defense      30.0                 24.0                 12.0                 12.0


*Based on HERO studies: ORALFORE, Barrier Effectiveness, and Combat Data Subscription Service.

** For armored and mechanized infantry divisions, these rates can be sustained for 10 days only; for the next 20 days standard rates for armored and mechanized infantry forces cannot exceed half these rates.


                This is a modeling construct built from historical data. These are “unmodified” rates. The modifications include: 1) General Terrain Factors (ranging from 0.4 to 1.05 for Infantry (combined arms) Force and from 0.2 to 1.0 for Cavalry or Armored Force, 2) Road Quality Factors (addressing Road Quality from 0.6 to 1.0 and Road Density from 0.6 to 1.0), 3) Obstacles Factors (ranging from 0.5 to 0.9 for both a River or steam and for Minefields), 4) Day/Night with night advance rate one-half of daytime advance rate and 5) Main Effort Factor (ranging from 1.0 to 1.2). These last five sets of tables are not shown here, but can be found in his writings.[5]


[1] The most significant works we are aware of is Trevor Dupuy’s ORALFORE study in 1972: Opposed Rates of Advance in Large Forces in Europe (ORALFORE), (TNDA, for DCSOPS, 1972); Trevor Dupuy’s 1979 book Numbers, Predictions and War; and a series of three papers by Robert Helmbold (Center for Army Analysis): “Rates of Advance in Land Combat Operations, June 1990,” “Survey of Past Work on Rates of Advance, and “A Compilation of Data on Rates of Advance.”

[2] See paper on the subject by Christopher A. Lawrence, “Advance Rates in Combat based upon Outcome,” posted on the blog Mystics & Statistic, April 2023. In the databases, there were 282 Western Europe engagements from September 1943 to January 1945. There were 256 Eastern Front engagements from February, March, July and August of 1943.

[3] See U.S. Army Staff Reference Guide, Volume I: Unclassified Resources, December 2020, ATP 5-0.2-1, pages xi and 220; and MAGTF Planner’s Reference Manual, MSTF pamphlet 5-0.3, October 2010, page 79. Both manuals include a table for division-level advances which is derived from Trevor Dupuy’s work, and both manuals contain a table for brigade-level and below advances which are calculated per hour that appear to also be derived from Trevor Dupuy’s division-level table. The U.S. Army manual gives the “brigade and below” advance rates in km/hr while the USMC manual, which appears to be the same table, gives the “brigade and below” advance rates in km/day. This appears to be a typo.

[4] Numbers, Predictions and War, pages 213-214. The sixth line of numbers, three numbers were changes from 1.85 to 1.25 as this was obviously a typo in the original.

[5] See Numbers, Predictions and War, pages 214-216.


The actual paper this was drawn from is here: Advance Rates in Combat

Wargaming 101: A Tale of Two Forces

Another article from William “Chip” Sayers. This article addresses some his work at the Defense Intelligence Agency (DIA) and his attempts to do some basic combat modeling efforts. The Gulf War ended in February 1991 with the defeat of the regular Iraqi army and the liberation of Kuwait. This article picks up four years later, when he had taken over the DIA’s Kuwaiti desk. As it is a nice integrated PDF discussion with maps and charts.

——-Bolding is mine ———–

Wargaming 101: A Tale of Two Forces

In September of 1994, Saddam Hussein ordered his Republican Guard to rush the border with Kuwait to test our resolve and reaction time. Inheriting Defense Intelligence Agency’s Kuwaiti desk a year later, I studied this exercise and pondered several questions. First, putting together the timelines showed that — in contrast to what the Clinton Administration claimed — Saddam began pulling the RG back before US troops ever landed in theater. This proved that he wasn’t contemplating an actual re-invasion unless, perhaps, the US failed to react at all to the provocation. 

In the event, the US unilaterally imposed a “no-drive zone,” similar to the no-fly zone over southern Iraq. While Iraqi military aircraft were not allowed to fly in the NFZ, only the Republican Guard was prohibited from entering the no-drive zone: The Iraqi Regular Army — not seen as a threat — was allowed to stay and operate in Southern Iraq. While the timelines imposed by the no-drive zone appeared to be sufficient to keep the Republican Guard out of Kuwait until reinforcements could arrive and fall in on prepositioned equipment at Camp Doha in Kuwait City, the question arose in my mind, “could the Regular Army spearhead an invasion and defeat the Kuwaiti Land Forces before we could intervene?” 

To explore this question, I needed two things: good intelligence on the forces and plans involved and a way to evaluate their probabilities of success. I was well supplied with excellent reports by observers in theater, so no problem there. The evaluation took a bit more creativity. I decided to use a version of Col. Dupuy’s technique he introduced in his book, The Options of Command. There, Col. Dupuy scored the armies facing each other in the May 1940 campaign in France and laid them out according to their historic dispositions. He then adjusted the forces by using the relevant terrain, posture and troop quality modifiers. Comparing the resultant power ratios, he surprisingly deduced that the French Army deployed itself exactly as though the Maginot Line fortifications did not exist. Taking the Maginot fortresses into account, he then suggested an alternative deployment that he convincingly portrayed as being capable of stopping the German advance through the Ardennes.

I proposed to do the same for the Kuwaiti Theater of Operations. The first order of business was to establish an order of battle for the two sides. The Kuwaiti Land Forces OOB were fairly easy: they were all in against an existential threat. Where things got complicated was the mish-mash of equipment the KLF was in the middle of procuring and the fact that the KLF was woefully undermanned and undertrained. The Kuwaiti Emir and Parliament believed that it was paramount that they get as many strong allies as possible interested in their survival, so their military procurement plan was to make a significant purchase of top-shelf equipment and weapons from as many different, militarily strong nations as possible. These countries included the United States, the UK, Russia, China and others. It didn’t matter that the equipment wasn’t necessarily designed to work together, it only mattered that Kuwait had many friends in high places. 

At the same time, the KLF had no equivalent to the US military’s Uniformed Code of Military Justice. If a KLF soldier failed to show up for training one day, there was no legal recourse to make that happen. Consequently, the KLF wasn’t making the progress in soldier training that it should. While their weapons were new and generally very good, they didn’t have enough trained soldiers to man them. It was as though the Kuwaitis had one boot on and one boot off.

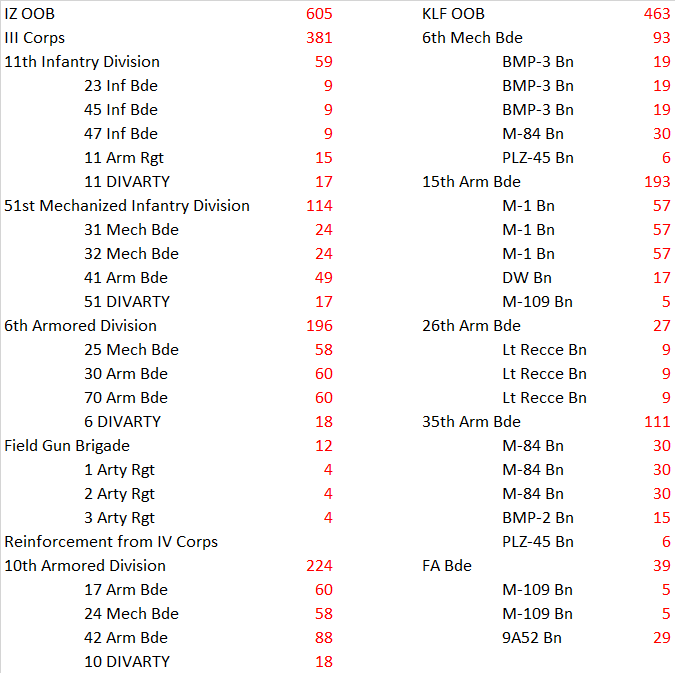
For the Iraqi side, I chose the Regular Army’s southernmost command, III Corps, with a possible reinforcement from IV Corps stationed just to the north. I gave them credit for having their full Table of Organization and Equipment (undoubtedly optimistic, but serving my purposes) and I scored the individual units using Col. Dupuy’s methodology and normed the scores to make them easier to work with. This resulted in the following table:

Note: DW = Desert Warrior IFV; PLZ-45 = Chinese SP Howitzer; M-84 = Yugoslav T-72 variant; 9A52 = Russian “Smerch” 300mm SP MRL; DIVARTY = Division Artillery; Lt Recce Bn = HMMWV battalion

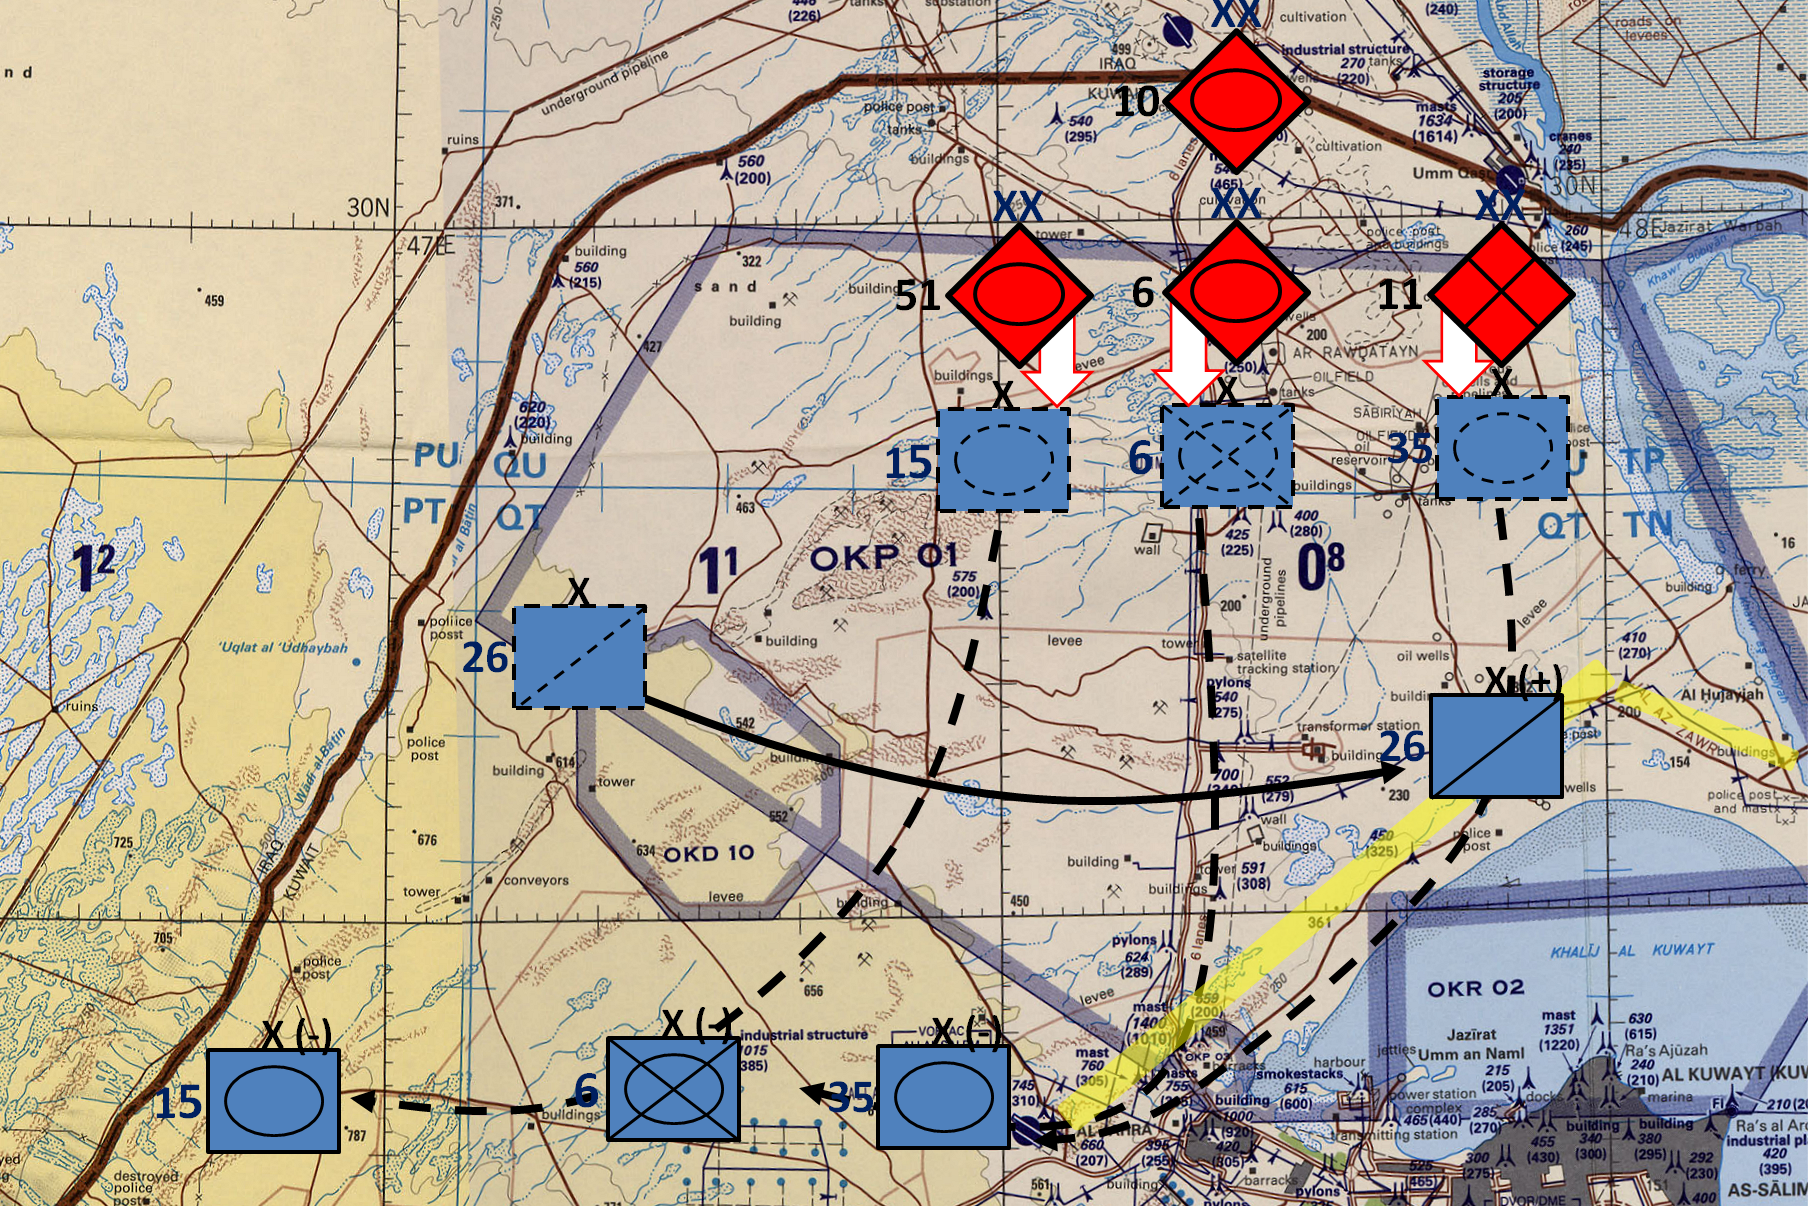
The next piece of the puzzle was the KLF’s deployments. Fortunately, the KLF had been running exercises that attracted much attention from observers, and there were few subtleties to add to what was fairly obvious on a map study. Their rough dispositions looked something like this:

KLF dispositions are in blue, while Iraqi formations are in red.  Note that the 6th Brigade’s maneuver battalions are on the border, constituting a covering force for the KLF.

At the time, the KLF 26th brigade was awaiting its compliment of M-1A2 tanks and Bradley Fighting Vehicles, so was relegated to observing the western approach to Kuwait City with its lightly armed HMMWVs. In a throwback to Patton’s 1944 XIX Tactical Air Command, they shared responsibility for stopping any Iraqi thrust down that road with the Kuwaiti Air Force.

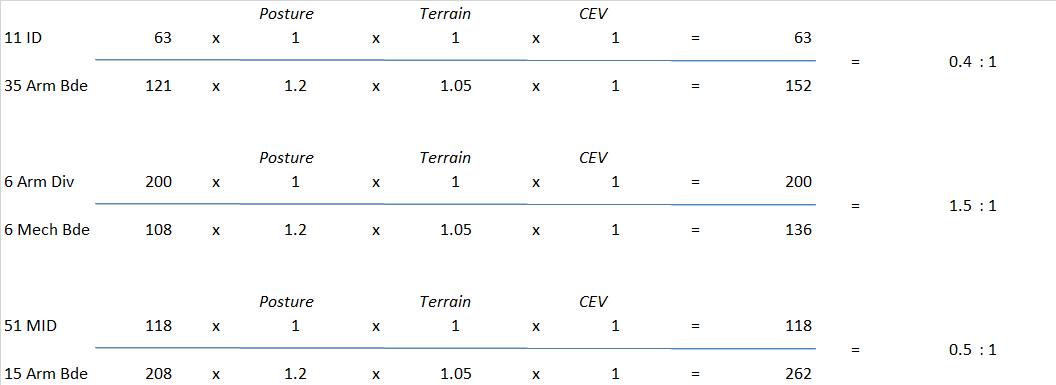
Overall, the two sides’ force ratios don’t look promising for the attacking Iraqis.

However, looks can be deceiving. While the conventional wisdom that the attacker requires a 3:1 superiority to succeed, the Soviet/Russian Correlation of Forces Methodology is more sophisticated and recognizes that as long as a commander can do economy of force operations in some sectors to enable concentration in others sufficient to overcome the defender, even an overall inferiority of combat power can be made to work. In this case, a 1:1 will serve the purpose. Consider the following CoFM formula:

Thus, on an overall frontage of 80km, the attacker can array his forces such that he can achieve a 3:1 superiority in a 16km wide strike sector. In this case, he has to allow a defender superiority of 2:1 outside the strike sector, but this isn’t a problem as the defender is not likely to recognize an opportunity to attack until it is too late, and even if he did, he would make little headway (the line of contact doesn’t begin to move rapidly until one side achieves a 3:1 superiority) while his forces inside the strike sector are frantically calling for help.

I set up the covering force battle like this:

The IZ 6th Armored Division can get a fairly overwhelming force ratio over the entire width of his zone of attack, and by loading up on its shared border with the 6th AD, the Iraqi 51st Mech Division can add a further 19km — for a total breakthrough zone of 46km, right in the middle of the line.  The KLF’s 6th Mech Bde would have to move fast to keep from being cut in two and swept away from its MLR positions.

The IZ 51st MID’s frontage in the Covering Force Battle

The Iraqi 11th ID is the weak sister of the force, but it merely has to keep the battalion opposite them occupied while the other two divisions blow through the center of the covering force area.

As this modified version of the Dupuy model does not assess casualties, the KLF 6th Mechanized Brigade is assumed to have broken contact and occupied their positions on the MLR without damage — a best case scenario for the Kuwaitis, to be sure.

Clearly, the assault on the main Kuwaiti defense positions will take some creative planning. However, all the Iraqis need is a breakthrough in one zone as there is virtually nothing behind it. The IZ 10th Armored Division has so far been held back as an exploitation force. If a normative breakthrough is achieved, the 10th AD will slip through the hole in the KLF lines and it will be game over. If the 10th is forced to assist in the breakthrough, things will be less certain for the Iraqis.

Many Iraqi senior officers attended Soviet academies where they learned CoFM calculations. The norms they would have learned to look for were a division breakthrough zone of 4km for a division and 2km for a brigade. So the question becomes, could they achieve at least one attack zone with a force ratio of at least 3:1 and at least 4km in width?

The negative number circled above indicates that the IZ 11th Inf Div cannot achieve a breakthrough.

Calculations for the IZ 6th Arm Div.  Note that it achieves a 4:1 ratio in the breakthrough sector and is twice the necessary width.

Again, the IZ 51st Mech Div cannot achieve a breakthrough.  The best the 51st can do is to make a fixing attack on the KLF 15th Arm Bde and keep them from interfering with the 6th AD’s breakthrough.

This constitutes a win for the Iraqis as 6th AD has achieved a breakthrough on twice the frontage required and can pass 10th AD through as an exploitation force. Further, this was done with a superiority of 4:1 as insurance to protect their vital main effort. While the breakthrough frontage may seem somewhat narrow to those with NATO army perspectives, the Iraqi units are somewhat smaller than their Soviet/Russian counterparts. Iraqi doctrine was a mix of east and west, but if they had applied CoFM calculations to this situation, the breakthrough frontage would have seemed somewhat spacious to their eyes.

Feeling somewhat satisfied with my results, I tried several other variations, including one with the KLF 15th Brigade deployed with its ultimate TO&E of Abrams MBTs and Bradley IFVs, and others with equipment substitutions and expansion. However, the most interesting scenario concerned with the training and manning issues within the KLF. I posited that if the Kuwaiti Government instituted a form of UCMJ and could then get its soldiers to show up for training, a 50% troop quality superiority could probably be justified when fighting the Iraqi Regular Army. The Kuwaiti Air Force had received its full compliment of F-18 fighters and its pilots had been trained up to excellent standards by the best trainers the US Navy had to offer.  They literally went from zero to the best air force in the Gulf region in the matter of a few short years. Perhaps some good discipline and training would have a similar effect on the KLF.

I set up the battle exactly as I had before, except that I included a 1.5 modifier for the KLF to represent a 50% superiority over the Iraqi Regular Army in training. This, I believed, was not excessive given the mass surrenders by the Regular Army in 1991 and (in retrospect) their non-appearance in 2003. We didn’t know until later that Saddam had essentially stripped the RA of useful equipment and soldiers to keep up the Republican Guard. In any event, the overall force ratios looked like this:

Starting out, this looks to be a much bigger challenge than in the base case. The covering force battle was still a likely win for the Iraqis, but again, not as easy as before.

The 6th Armored and 51st Mech can still breach the covering force area, albeit on a smaller but still sufficient frontage, than in the base case. However, it’s the fight for the KLF’s primary defensive positions that will tell the tale.

The 11th Infantry Division is, not surprisingly, a lost cause and no amount of adjusting frontage can give them any possibility of stopping the KLF’s 35th from mounting a counterattack with a 2.3:1 force superiority, generating a 6:1 superiority on a breakthrough frontage of 9km. Or better yet, shifting half its combat power to bolster 6th Mech Bde.

Continuing with the IZ 6th Armored Div/KLF 6th Mech Brigade’s sector, the Iraqi force can generate a 4:1 ratio over the minimum required 4km.  As in the base case, a 4:1 ratio was chosen to add a pad for insurance on the main effort axis. However, if the Kuwaiti 35th Brigade extended its left-flank boundary far enough to the west to allow half of its combat power to defend against the 6th Arm Div, as suggested, above.

As can be seen, this case drives the breakthrough frontage to an insufficient 1km, even while only requiring a 3:1 superiority. With the IZ 51st Mech Div starting out with a .3:1 inferiority opposite the KLF 15th Armored, it’s clear that they won’t be able to stop a shift of forces to eliminate any possibility of a breakthrough in the center sector, or better yet, a left-hook counterattack at a superiority of 6:1 with the possibility of rolling up IZ III Corps in its entirety.

This seems to prove fairly definitively that III Corps has no chance of winning the battle for the KLF’s main line of resistance without reinforcement from IV Corps’ 10th Armored Division. Even at that, the Kuwaitis could likely make an orderly withdrawal to positions west of Ali al Salem Air Base extending to Wadi al Batin, where the terrain is still favorable for armored warfare, while leaving small forces to block any advance down Kuwait City-Safwan highway (the infamous “highway of death”) where the road comes down off the Jal Az-Zor escarpment, and the coastal road at the base of the escarpment.

The KLF redeploys to its 2nd MLR. The 26th Bde picks up reinforcements from the other three brigades and picks up the mission to delay or block any Iraqi attempt to come down off the Jal Az-Zor escarpment (approximate location shaded in yellow).

None of this analysis has included the role of the Kuwaiti Air Force. Without turning this into an air forces analysis piece, 40 well-flown F-18s would have made quick work of the Iraqi Air Force. These fighters and the KAF’s 16 Apache Longbow attack helicopters would have added a powerful layer of interdiction and Close Air Support firepower to the mix.

Satisfied that I was onto something with this initial cut, I wanted to involve the Iraqi senior analyst and others in the process. I had seen the pitfalls of doing a study like this with no one to play Red Force or even give advice on how the other side would really play in such a scenario. However, my pitch fell flat: no one could conceive of a situation in which the Republican Guard would not lead such an operation, and that rendered this study moot. No matter how I argued for the need to study this scenario, or some of the interesting things I had pulled from the initial run, I got no interest. So, the project collected dust in a filing cabinet. 

All was not lost. I had learned a great deal on how to do such a project and some of the information did make it into a report for which I received a handwritten note of commendation from Defense Secretary William Perry. I had wanted to introduce wargaming into the analytical process as a tool for those who saw a use for it. We had some great success in training new analysts with wargames and earned high praise from students who didn’t understand how military forces worked until they had to learn their force capabilities and make decisions of consequence in a dynamic simulation. However, when those same analysts graduated and dispersed to their various desks, most never gave another thought to wargaming. I suspect they didn’t have confidence in the utility of our simulations in the real world where lives are on the line. That’s on me — I obviously did not explain sufficiently where this model came from and how well it had performed in real situations. 

Still, if this effort was to get anywhere, I needed management buy-in. And for a brief moment at the end of the 1990s, I thought I had that. But that’s a topic for another post.

——————–

A link to a .pdf of the article is here: KTO.

TLIs and Gun Control

Well, Trevor Dupuy’s work on the Theoretical Lethality Index (TLI) that was done back in 1964 has entered into the U.S. gun control debate, not by our choice.

We discussed an earlier work that addressed this at Common Use, Lineage, and Lethality | Mystics & Statistics (dupuyinstitute.org). This first came to our attention through an article posted by CNN that generated thousands of pingbacks to our site: Opinion: Now that guns can kill hundreds in minutes, Supreme Court should rethink the rights question | CNN.

Even though I have my doubts about the utility of using the Theoretical Lethality Index for discussing gun control, I did attend and present at the conference “Current Perspectives on the History of Guns and Society” in mid-October. See: Conference: Current Perspectives on the History of Guns and Society | Mystics & Statistics (dupuyinstitute.org)

Attending this conference did lead to some useful discussions about collecting data on lethality and weapons effects in a civilian environment, similar in some respects to what I had in Chapter 15 (Casualties) in War by Numbers. This has been discussed before on this blog: Wounded-to-killed ratios in Ukraine in 2022 | Mystics & Statistics (dupuyinstitute.org) and Two proposals on Combat Casualties | Mystics & Statistics (dupuyinstitute.org). I am currently not actively trying to market an effort to further explore wounded-to-killed ratios in modern combat (although I think this is sorely needed) and I am not marketing any efforts to look at lethality in a civilian environment.

Now, there is an article contesting the original articles on the subject on the website The Volokh Conspiracy by David Kopel called “The Theoretical Lethality Index is useful for military history but not for gun control policy.” This blog post, which is rather long, is here: The Theoretical Lethality Index is useful for military history but not for gun control policy (reason.com).

Part IV of the article actually “estimates” the TLI of an assault rifle at 640. This seems a little low. It is clear that TLIs of assault rifles are 800-900 or higher, depending on the model of the rifle and how they are calculated. David Kopel’s article provides the following figures:

18th Century Flintlock: 43
1903 Springfield bolt-action magazine-fed rifle: 495
Modern AR semiautomatic rifle: 640
Modern 9mm semiautomatic handgun: 295

Not sure why they needed to “estimate” the TLI of an assault rifle (AR), as it can be calculated using the formulae in Numbers, Predictions and War. We do have lists of various TLIs for a wide variety of weapons. We do have a complete list on the DOS version of the TNDM which I am too lazy or too busy right now to get up and running. But, we did do have some old listings and spreadsheet calculations sitting around on my computer from past model validation runs. So, let me quote some figures from those efforts:

From Excel spreadsheet:
Soviet Tula-Tokarev 33 Pistol = 297.36 (7.62mm)

From WPN_LIST-WWII:
Soviet AK-47 Assault Rifle = 831.685
7.92mm FG 42 Assault Rifle: 789.823
7.92mm MP 43/StG 44 Assault Rifle: 904.045

We did check back with Chip Sayers who keeps his own listings he has calculated, and they show:

Tokarev TT-33 semi-auto 7.62mm pistol – 265 
9mm Parabellum-Pistole Luger P08 – 228
9mm Walther P.38 – 229
AK 7.92mm Assault Rifle – 813
Sturmgewehr 44 – 868
 
Calculations vary a little from using to user depending how they determine what the practical sustained rate of fire for a weapon on a per-hour basis, maximum effective range and accuracy (often an estimation) of the weapon is (see pages 187-199 of Numbers, Predictions and War).
 
I guess we could go back and do the calculations for a whole range of assault rifles, but I have a lot on my plate at the moment. Certainly, someone else could do this with a little investment of time. The formulas for the TLI are public.
 
Anyhow, I am not going to enter this gun debate. The TLIs were designed for use in analyzing combat. While they are not directly applicable to the civilian world, they are illustrative. How relevant they are for discussions on gun control I will leave for others to argue. That is not our business.
 
But… there is one statement is David Kopel’s argument I must take issue with, which is “Extrapolating from the historic arms that Dupuy studies to present-day arms is questionable.”
 
Now, we have used the TNDM, which uses the formulae for the TLIs, as part of our effort to both analyze combat in the past and to analyze combat in the present. This construct developed in 1964 was used as part of our predictions for the Gulf War in 1991 (see: Forecasting the 1990-1991 Gulf War | Mystics & Statistics (dupuyinstitute.org) and Assessing the TNDA 1990-91 Gulf War Forecast | Mystics & Statistics (dupuyinstitute.org) and Assessing the 1990-1991 Gulf War Forecasts | Mystics & Statistics (dupuyinstitute.org). Needless to say, these predictions did better than most predictions at the time, and certainly did better the recent U.S. “intelligence communities” predictions for Afghanistan in 2021 or Ukraine in 2022. As I note: I like to claim that we are three-for-three in our predictions… | Mystics & Statistics (dupuyinstitute.org) or maybe four-for-four: Does this mean that we are four-for-four in our predictions? | Mystics & Statistics (dupuyinstitute.org).


The TNDM was also used for part of our prediction efforts on Bosnia in 1995 (see Forecasting U.S. Casualties in Bosnia | Mystics & Statistics (dupuyinstitute.org), reports B-0 and B-1 here TDI – The Dupuy Institute Publications and America’s Modern Wars) and has been used for others for a number of their own efforts in 2022 (see An Independent Effort to Use the QJM to Analyze the War in Ukraine | Mystics & Statistics (dupuyinstitute.org) and A Second Independent Effort to use the QJM/TNDM to Analyze the War in Ukraine | Mystics & Statistics (dupuyinstitute.org)). So, we are using TLIs for present day armies. We also did studies comparing proposed modern armor brigades with WWII armor divisions, which we have never blogged about (see FCS-1 and FSC-2 TDI – The Dupuy Institute Publications), although the corps and division-level model validation charts from that effort are in Chapter 19 (Validation of the TNDM) of War by Numbers and is reference here: Validating Trevor Dupuy’s Combat Models | Mystics & Statistics (dupuyinstitute.org). Some of our discussions on model validation are here: Summation of our Validation Posts | Mystics & Statistics (dupuyinstitute.org).

But, there is also Dr. Alexander Kott’s work which extrapolates weapons developments into the future, using a set of formulas similar to the TLI. This is discussed here The Evolution of Weapons and Warfare? | Mystics & Statistics (dupuyinstitute.org) and here Data Used for the ARL Paper | Mystics & Statistics (dupuyinstitute.org) and here Data Used of the ARL Paper – post 2 | Mystics & Statistics (dupuyinstitute.org) and here Technological Advancement Lessons from History? | Mystics & Statistics (dupuyinstitute.org) and here Two ARL Reports | Mystics & Statistics (dupuyinstitute.org). So, if David Kopel’s statement is correct, then the work Dr. Alexander Kott is doing at the Army Research Lab (ARL) is not valid. Dr. Kott did present his work at the Historical Analysis Annual Conference (HAAC) in late September and his briefing will be posted to this blog.

The 88th Infantry Division Stole a Cake

Speaking of war crimes, I spotted this story today: US Army ‘returns’ cake to Italian woman for 90th birthday.

The 88th Infantry Division in Italy in 1944 in one of the units we have studied in some depth. There was a report done on it in 1981. See: 88. Performance of The 88th Infantry Division in World War II: Factors Responsible for its Excellence (1981) (MRA&L) – Pages: 120 at http://www.dupuyinstitute.org/tdipub1tnda.htm

This is also discussed on pages 114-121 of Trevor Dupuys Understanding War. He ended up conducting an analysis of the CEVs (Combat Effectiveness Values) of seven U.S. units, five UK units and 12 Germans units in Italy during WWII. This was done using his Quantified Judgment Method of Analysis (QJMA). Of those 24 units, the 88th Infantry Division was rated the fifth highest, based upon 4 engagements. It had a CEV of 1.14. It was the highest rated of all the allied units.

Ordering info is here: http://www.dupuyinstitute.org/booksfs.htm

Related posts:

Human Factors In Warfare: Combat Effectiveness | Mystics & Statistics (dupuyinstitute.org)

JSTOR, Trevor Dupuy, Combat Data and the 3:1 Rule

In moments of quiet I sometimes search the internet to see if people are referencing our work. Sometimes I run across articles and discussions I have forgotten about. This was one of them: Combat Data and the 3:1 Rule

We have blogged about this subject a few times before (and even referenced the JSTOR article):

The Source of the U.S. Army Three-to-One Rule | Mystics & Statistics (dupuyinstitute.org)

The U.S. Army Three-to-One Rule versus the 752 Case Division-level Data Base 1904-1991 | Mystics & Statistics (dupuyinstitute.org)

The U.S. Army Three-to-One Rule versus 49 U.S. Civil War battles | Mystics & Statistics (dupuyinstitute.org)

The U.S. Army Three-to-One Rule versus 243 Battles 1600-1900 | Mystics & Statistics (dupuyinstitute.org)

The U.S. Army Three-to-One Rule | Mystics & Statistics (dupuyinstitute.org)

The Great 3-1 Rule Debate | Mystics & Statistics (dupuyinstitute.org)

The 3-to-1 Rule in Recent History Books | Mystics & Statistics (dupuyinstitute.org)

Questioning The Validity Of The 3-1 Rule Of Combat | Mystics & Statistics (dupuyinstitute.org)

Comparing the RAND Version of the 3:1 Rule to Real-World Data | Mystics & Statistics (dupuyinstitute.org)

TDI Friday Read: The Validity Of The 3-1 Rule Of Combat | Mystics & Statistics (dupuyinstitute.org)

The 3-to-1 Rule in Histories | Mystics & Statistics (dupuyinstitute.org)

Trevor Dupuy and the 3-1 Rule | Mystics & Statistics (dupuyinstitute.org)

Attrition has been discounted to $877.95

One can find a copy of Attrition: Forecasting Battle Casualties and Equipment Losses in Modern War on Amazon.com for $877.95. It used to sell for $890.

Attrition for $900 | Mystics & Statistics (dupuyinstitute.org)

On the other hand, we are still selling new copies for the list price of $19.95. See here: http://www.dupuyinstitute.org/booksfs.htm

Ordering information is here: http://www.dupuyinstitute.org/order.htm

Staff Reference Guide

The U.S. Army Staff Reference Guide, Volume I: Unclassified Resources, December 2020, ATP 5-0.2-1 has been released.

Link to it is here: https://armypubs.army.mil/epubs/DR_pubs/DR_a/ARN31193-ATP_5-0.2-1-000-WEB-1.pdf

There are ten references to “Dupuy” in the guide, which I believe is a first. I do not recall any previous Army manual referencing Trevor Dupuy’s work, even though I have seen his work in a manual or two without reference. It is nice that they have properly acknowledged his work.

The references are on:

  1. Page xi: “Acknowledgements”: four references, two for Colonel Trevor N. Dupuy and two to his son Arnold C. Dupuy,. Ph.D.
  2. Page 220: Table D-6. Division opposed rates of advance (km/day). I will have more comments about this table later.
  3. Page 285. Paragraph G-162, Casualty Estimates: Two references. I will probably have a blog post about this later.
  4. Page 402. References: Three references. I will probably have a blog post about this later also.

The two Trevor N. Dupuy books referenced in the Staff Reference Guide are the still out of print Numbers, Predictions & War (1979) and Attrition: Forecasting Battle Casualties and Equipment Losses in Modern War (1995). We still have 40 or so copies of Attrition for sale. See http://www.dupuyinstitute.org/booksfs.htm


Their Wehrmacht was Better than our Army

Poking around the internet, I ran across an article from 1985 by the British journalist and historian Max Hastings, rather provocatively titled “Their Wehrmacht was Better than our Army.” It was published in the Washington Post. I had not seen it before (as I went to work for Trevor Dupuy in 1987):

https://www.washingtonpost.com/archive/opinions/1985/05/05/their-wehrmacht-was-better-than-our-army/0b2cfe73-68f4-4bc3-a62d-7626f6382dbd/

A few highlights:

  1. The language in the first couple of paragraphs is also pretty provocative. 
  2. The discussion then goes to Liddell Hart.
  3. The discussion then goes to Trevor Dupuy and Martin Van Creveld.
  4. From Dupuy: “On a man for man basis, German ground soldiers consistently inflicted casualties at about a 50 percent higher rate than they incurred from the opposing British and American troops under all circumstances. This was true when they were attacking and when they were defending, when they had a local numerical superiority and when they did not, when they won and when they lost.”
  5. From Hastings: “A spirit of military narcissism, nourished by such films as “The Longest Day,” “A Bridge Too Far” and “The Battle of the Bulge,” was perpetuated mythical images of the Allied and German armies.”
  6. From Hastings: “Yet to be a soldier in America has never been the honorable calling, outside a few thousand Army families. It has traditionally been the route by which young men of modest origins…may aspire to build a career.”

It is worthwhile to read the entire article.

Now, these claims were controversial in the 1980s, and a number of U.S. Army officers and people out at Leavenworth personally and professionally went after Trevor Dupuy over this issue. There was a long unpleasant discussion of that story written up by the lawyer Thomas Nutter. He was going to turn into a book, but I gather that effort was never completed.

I do address the subject of the relative performance of armies in combat in Chapters 4 through 7 of my book War by Numbers. 


Attrition for $900

I was on the phone with someone earlier today and he told me that Attrition: Forecasting Battle Casualties and Equipment Losses in Modern War was on sale on Amazon.com for only $900. I took a look, and sure enough, they have used one for $121.00 and a new one $890. That is it.

On the other hand, we still have new copies for sale for the list place of $19.95. See here: http://www.dupuyinstitute.org/booksfs.htm

I have not taken inventory in a while, but we still have 40 or so available.

Ordering information is here: http://www.dupuyinstitute.org/order.htm

Maybe I should start selling on Amazon.com and undercut them with an offer of $889.99.

Trevor Dupuy’s Definitions of Lethality

Two U.S. Marines with a M1919A4 machine gun on Roi-Namur Island in the Marshall Islands during World War II. [Wikimedia]

It appears that discussion of the meaning of lethality, as related to the use of the term in the 2018 U.S. National Defense Strategy document, has sparked up again. It was kicked off by an interesting piece by Olivia Gerard in The Strategy Bridge last autumn, “Lethality: An Inquiry.

Gerard credited Trevor Dupuy and his colleagues at the Historical Evaluation Research Organization (HERO) with codifying “the military appropriation of the concept” of lethality, which was defined as: “the inherent capability of a given weapon to kill personnel or make materiel ineffective in a given period, where capability includes the factors of weapon range, rate of fire, accuracy, radius of effects, and battlefield mobility.”

It is gratifying for Gerard to attribute this to Dupuy and HERO, but some clarification is needed. The definition she quoted was, in fact, one provided to HERO for the purposes of a study sponsored by the Advanced Tactics Project (AVTAC) of the U.S. Army Combat Developments Command. The 1964 study report, Historical Trends Related to Weapon Lethality, provided the starting point for Dupuy’s subsequent theorizing about combat.

In his own works, Dupuy used a simpler definition of lethality:

He also used the terms lethality and firepower interchangeably in his writings. The wording of the original 1964 AVTAC definition tracks closely with the lethality scoring methodology Dupuy and his HERO colleagues developed for the study, known as the Theoretical Lethality Index/Operational Lethality Index (TLI/OLI). The original purpose of this construct was to permit some measurement of lethality by which weapons could be compared to each other (TLI), and to each other through history (OLI). It worked well enough that he incorporated it into his combat models, the Quantified Judgement Model (QJM) and Tactical Numerical Deterministic Model (TNDM).