Category Demographics

Japan versus Germany

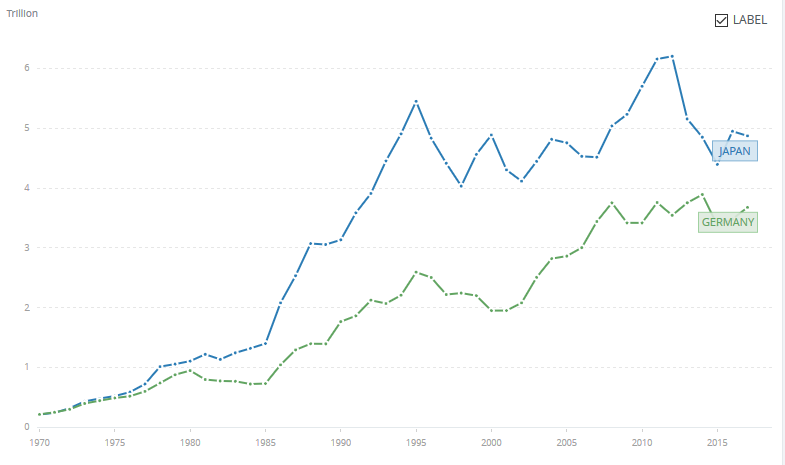
Comparing Japan and Germany is an interesting exercise….as they kind of started at the same point. Their leaders in World War II were disgraceful incompetents who got their nations into wars they could not win, leading to them being bombed into oblivion and then occupied. They both started at the same point for recovery. In 1970 Japan had a GDP of 212.609 billion while Germany had a GDP of 215.022 billion. They oddly enough, almost ended up at at the same point, for in 2017 Japan had a GDP of 4.872 trillion while Germany had a GDP of 3.677 trillion. Considering that in 2017 the Japanese population is 127 million, and the German population is 82 million, at this stage Germany actually had the higher per capita income, being $44,550 compared to $38,440 (or $50,206 compared to $42,659 using PPP – Purchasing Power Parity, IMF 2017 figures). On the other hand, their trips to these points are very different as shown in this graph, showing their GDP from 1970-2017:

From 1970 through 1977 their economic growth almost parrelled each other. After that Japan’s economy started growing faster, then it boomed and after 1995 it busted. The German economy also declined after 1995, but since then seems to have grown and then stabilized.

While both nations have a fertility rate well below 2.1 (which is the replacement rate) they have reacted differently to immigration. Germany has been far more accepting of immigration than Japan. The end result is that Germany’s population is projected to still be at around 79 million in 2050 while Japan is expected to decline to 109 million. I am probably on safe ground to state that in the long run, Germany will have a higher GDP than Japan, meaning it will probably rise to be the third largest economy in the world.

Where Did Japan Go?

This post is a follow-up to this posting:

Demographics of Japan

In that post, I was talking about that there was a time in the 1980s when Japan’s GNP was 60% of the United States and people were talking about Japan’s economy outgrowing the United States by the year 2000, 2010 or 2020. Now…..we know that did not happen. The following chart, measuring GDP (Gross Domestic Product) shows this change of fortune rather dramatically:

In 1995, Japan’s GDP was $5.449 Trillion while the United States was $7.664 Trillion. Japan’s GDP was 71% of the United States and it looked to be closing. Now, in 2017 it was 25% of the United States ($4.872 versus $19.391). This is a hell of a change in fortune. Not near as bad as the collapse as the Soviet Union, but pretty damn significant in the larger picture.

Let us look how this developed over time (figures are from the World Bank):

Year       Japan GDP     U.S. GDP     Percent

1960         .044307          .5433             8%

1965        .09095             .7437           12%

1970        .212609         1.076             20%

1975        .521542         1.689             31%

1980       1.105              2.863             39%

1985       1.399              4.347             32%

1990       3.133              5.98               52%

1995       5.449              7.664             71%

2000       4.888             10.285            48%

2005       4.755             13.094            36%

2010       5.7                 14.964            38%

2015       4.395             18.121            24%


That is a trip. If the percentages were graphed out, it might start looking like a bell curve. I don’t have the depth of knowledge on the Japanese economy to pontificate as to why this developed this way.

So, we have seen a political and military challenge after World War II from the Soviet Union. They went from claiming that “We will bury you” (1956) to dissolving (1991). We have seen an economic challenge from our ally Japan, and it certainly impacted our car industry and consumer electronics. This has gone in only two decades from a point where the economic growth trajectory lines of Japan seemed to be on track to surpassing the United States to a point now where Japan’s economy is a quarter of our economy. And…..it still does not appear to be growing much. It makes you wonder about the next political, military or economic challenge…..and how that will play out.

What would a reconstituted Soviet Union/Russian Empire look like?

The Soviet Union broke up into 15 separate countries in December 1991. What would a reconstituted Soviet Union/Russian Empire look like, if that is indeed one of the goals of Russian leadership (and some people say it is).

1. Russia, 2. Ukraine, 3. Belarus, 4. Uzbekistan, 5. Kazakhstan, 6. Georgia, 7. Azerbaijan, 8. Lithuania, 9. Moldavia, 10. Latvia, 11, Kirghizia, 12. Tajikistan, 13. Armenia, 14. Turmenistan, 15. Estonia.


The three Baltic states appear to be out of their grasp, being members of NATO. They are militarily protected by an alliance of 29 members, and their economic growth has been significant. The per capita income of Estonia is $19,840 (IMF 2017), while that of Russia is $10,608. Half of Russia’s GDP is in Moscow, just to drive home what the rest of the country is like.

Some of these countries are united into the Eurasian Economic Union. It consists of five countries: Russia, Armenia, Belarus, Kazakhstan, Kyrgyzstan. It was Ukrainian President Yanukovych’s decision to develop closer economic ties with Russia and the Eurasian Union and back away from an association agreement with the European Union (28 countries) that started the Euromaiden protests in November 2013 that lead to his removal from power in February 2014 (and the Russian seizure of Crimea and the Russian-influenced revolts in Lugansk and Donetsk). The Eurasian Union flag is below. Interesting map choice.

So who would be in a reconstituted Soviet Union/ Russia Empire?

There are the five “stans” in Central Asia (Kazakstan, Uzbekiskan, Kyrgystan, Tajikistan, and Turkmenistan). By the nature of their geography they are somewhat isolated, landlocked, and potentially could be brought back into Russia’s orbit. Two countries are already members of the Russian created Eurasian Union. There is also Belarus, another Eurasian Union member. Belarus does not have a strong history of independence and could be brought back into Russia’s orbit. Belarus might very well rejoin Russia after its dictator Lukaschenko (age 64) moves on to wherever he ends up. These could reconstitute a new force if they could be brought into Russia’s orbit. Some stats:

                            (2018 est.)                 (IMF 2017)

                            Population                 GDP (millions)

Russia                  146,877,088              $1,527,469

Uzbekistan             32,653,900                    47,883

Kazakhstan            18,292,700                  160,839

Belarus                     9,478,200                    54,436

Tajikistan                  8,931,000                      7,234

Kyrgystan                 6,309,300                      7,061

Turkmenistan           5,851,466                    37,926

Sub-Total              228,393,654              1,842,848


This adds up. It is more significant demographically than economically. The per capita income of Uzbekistan is $1,491 per year and Kyrgyzstan and Tajikistan are worse. This recombined country would move from being the 12th richest in the world up to being the 10th richest, ahead of Canada but behind Italy.

Now there are three countries in the Caususus: Georgia, Azerbaijain, and Armenia and four odd political entities (Abkhazia, North Ossetia, Artsakh and Chechnya). Of the three former Soviet countries, Georgia is openly hostile to Russia (and Abkhazia and North Ossetia have been carved from it) and Azerbaijain and Armenia are hostile to each other. They fought a war over the province of Nagorno-Karabakh from 1988-1994, which Armenia won. It is now the Republic of Artsakh.
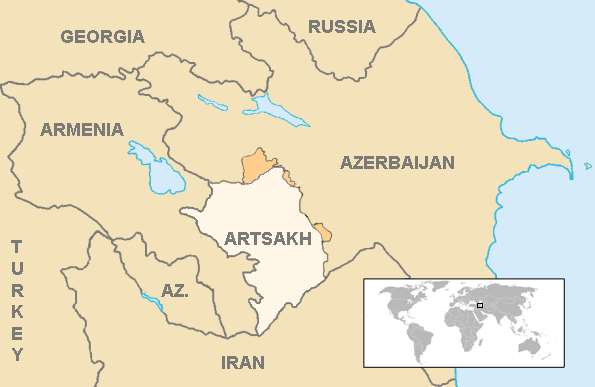
Only Armenia is a member of the Eurasian Union. It will be difficult for Russia to bring these three nations into its fold for a number of reasons, but again they remain relatively isolated with only Iran and Turkey as the neighbors in the region. So…lets us assume this somehow happens:

                            Population                 GDP (millions)

Old Sub-total     228,393,654                1,842,848

Azerbaijain             9,943,226                      40,670

Georgia                  3,729,600                      15,230

Armenia                  2,969,800                     11,037

Abkhazia                    240,705                     N/A

Artsakh                      145,053                      N/A

New sub-total    245,422,038                1,909,785


They are all pretty poor, with Azerbaijan having a per capita income of $4,141 and Georgia and Armenia having similar slightly lower numbers.This really does not get a new Russia Empire back to being a world power. Italy still has a larger GDP.

This now assembles 10 of the original 15 republics together. The three Baltic states are out of reach without a world war, and that leaves only Ukraine and Moldova.

                          Population                 GDP

Ukraine             42,248,129                 109,321

Moldova              3,550,900                    7,945

Transnistria           470,600                      N/A


Note that the Ukrainian population figures excludes Crimea and Sevastopol but includes Lugansk and Donetsk. The per capita income of Ukraine is $2,583 and Moldova is $2,280.

It is clear that if one was going to re-constitute the Soviet Union/Russian Empire that Ukraine is the real prize here. Some argue that this is what the conflict in 2013-2014 was about, and is the source of the continued conflict over Crimea, Lugansk and Donetsk.


P.S. The stats for the three Baltic states are:

                       Population                 GDP

Lithuania        2,799,127                    47,263

Latvia             1,923,400                    30,319

Estonia           1,319,133                    25,973
Population over Time (US vs USSR)

Over last decades, the population of major countries like China, India, Soviet Union/ Russia, Japan, Germany and the United States have changed. This has clearly changed the balance of power between them and will continue to as we move forward into the future. For example:

Unite States versus Soviet Union:

                                              Soviet Union/

Year           United States      Russia                    Ratio

1950/51      151.3 (1950)        182.3 (1951)           0.83-to-1

1980/82      226.5 (1980)        270.0 (1982)           0.84-to-1

2018           308.7                    142.9                      2.16-to-1

2050           402                       132                         3.05-to-1


Now, this is certainly the biggest change we will look at. Russia went from almost being a world power to being a pale reflection of its past power and glory (I am willing to argue that the Soviet Union was never really a world power….it just pretended to be one). Added to that is the economic changes over time. I hesitate to even discuss what the GDP of the Soviet Union was, as the ruble was artificially inflated. When it was floated in the 1990s, it went from one ruble per 1.11 dollars (it always was worth more than a dollar in the Soviet era, of course)…to something like 3,000 rubles to a dollar. They then shaved off two the zeros for the new ruble to make it less than 30 rubles to a dollar. The current exchange rate is 65 rubles to a dollar.

The current Russian GDP is 1.5 trillion (IMF 2017). This is compared to the United States GDP of 19.4 trillion (IMF 2017). So, right now, Russia has less than half the population and less than a tenth of the economy of the United States. In 2050 it will have only a third of the population of the U.S. Who knows what the economy will be. The Russia economy might still be pretty dependent on the price of oil.

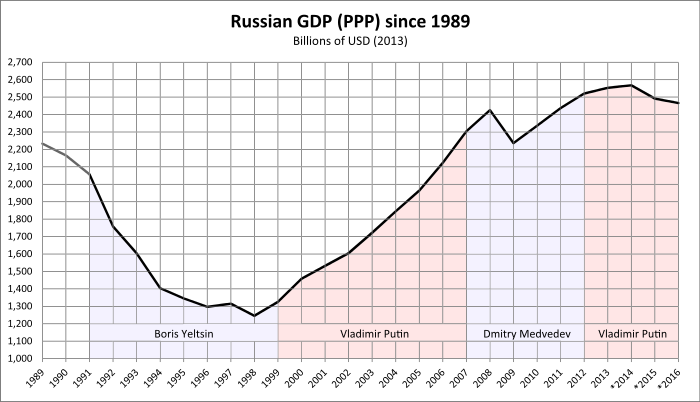
With its population declining, its work force aging, its economy built upon export of oil and gas, with wide spread corruption, and an entrenched leadership; it is hard to imagine that Russia’s economy will have an extended economic growth that will return it to being a great power. Its economic growth last year (2017) was 1.5%. Russia is currently the 11th or 12th richest country in the world. It is behind Canada. My seat-of-the-pants estimate is that Russia will still not be among the 10 richest countries in 2050.

For Russia to return to its old glory, it really sort of needs to re-constitute the Soviet Union or the old Russian Empire to some degree. Some would argue that this has indeed been part of Putin’s plan. I will examine this in a future post.

Demographics of Germany

Germany is the richest country in Europe. It is the second most populous country in Europe (after Russia). It is the fourth richest country in the world. Its demographic situation is similar to many of its neighbors, which include several nearby large counties of around 60 million people, the United Kingdom, France and Italy. Each are unique, but because of its central position in Europe, this is a perfectly good case to examine.

The population of Germany is almost 83 million (82,800,000 in 2017 estimate). The rate of growth has been slow. In 1939, they had 69 million people (inside current borders: not counting territory and population gains in the 1930s). They still only had 69 million in 1950. Its fertility rate is now 1.59 children born per woman (2016 estimate). This is low, but not as low as Japan. Since the 1970s, the German death rate has exceeded its birth rate. Its fertility rate has been below 2.00 since 1970.

Unlike Japan, there has been significant immigration to Germany. The rate of immigration to Germany, relative to the size of their population has been higher than in the United States. About 7 million of Germany’s residents do not have German citizenship and over 10 million of the people in Germany (12%) were born outside of Germany. They tend to be from everywhere, Turkey, Poland, Russia, Italy, Romania, Greece, Syria, other EU countries, and so forth.

So….the picture is different when it comes to the demographic “pyramid,” although because of the low birth rates, it is still not very pyramidal. Not as bizarre looking as Japan’s, but this clearly still shows a shortage of young labor and a potential burden on the younger generation as the larger older population ages.

In many respects the comparison between Japan and Germany is most interesting, as Japan is a case of a country with low birth rate that does not have significant immigration, while Germany is the opposite. A proper in-depth study of this would look at the macro and micro economic impacts of this, the social impacts, and the long-term strengths and weaknesses these countries develop as a result of this. It is not a task I will be taking on.

As far as what the estimates for German population in 2050, hard to imagine it is going to be significantly different than what is today. It only grew 14 million in the last 80 or so years. A lot of this growth is due to immigration. So the United Nations estimates it will be 79 million in 2050. Sounds perfectly reasonable, although it is dependent on their continued immigration policy.

I have now briefly looked at six countries in the world, Russia, United States, China, India, Germany and Japan. This includes the three most populous counties in the world (followed by Indonesia, Brazil, Pakistan, Nigeria, Bangladesh, Russia, Mexico and Japan). They include five of the six richest countries in the world (with the UK being fifth on the list and France being seventh). I think that will be all for now.

Demographics of Japan

There was a time in the 1980s when Japan’s GNP was 60% of the United States and people were talking about Japan’s economy outgrowing the United States by the year 2000, 2010 or 2020…but in our lifetime. Well, I am still alive and they have not. Right now, Japan’s GNP is about 25% of the United States (IMF 2017 figures) and it does not look like they are going into any extended economic boom any time soon. Now, this talk in the 1980s was understandable if one took a straight line of the Japanese economic growth over the previous couple of decades, and compared it the U.S. economic growth of say, the 1970s. And…if you assumed those two lines would continue unchanged for the next few decades, you could get there. That is obviously not what happened. Japan’s place as the booming economic challenger was replaced by the “Asian Tigers” and then by the Peoples Republic of China. Japan’s current GDP is growing at 1.7% a year (2017). One of the several underlying reasons for this slow growth is due to their shortages in workforce, caused by their demographics.

The population of Japan as of the 2017 census is 127 million people (126,672,000). It is the tenth most populous country in the world (just after Russia). They remain the third richest country in the world (3rd in GNP) after the United States and China.

In 1985 their population was 121 million. This is not much growth. Mostly the population is getting older and grayer. In 2012, 24% of the population was over 65 and it is projected to rise to almost 40% by 2050. The good news is that Japan has the second longest overall life expectancy of any country in the world at 83.5 years. Since 2010 Japan has had a net population loss caused by falling birth rates and almost no immigration. Its fertility rate is 1.41 children per woman (2012), which is by far the lowest figure of any of the countries we have discussed. This is an improvement from 2001-2005, when it was 1.32.

Oddly enough, Japan controlled its population in the previous two centuries. Japanese population remained around 30-35 million people for around 150 years, from the early 1700s (their first census was in 1721). This is unusual, extremely unusual as it was not caused by any natural or man-made disaster. It appeared to be caused by a culture of family planning that simply resulted in the population remaining relatively steady. I don’t know enough about Japanese history to know why this developed, but it is trend that you see in almost no other country in the world in the 1800s. Just to make everyone uncomfortable, apparently this population control was helped by “infanticide” (mabiki).

Japan is a country that is not very encouraging for immigration. It is 98.5% Japanese, 0.5% Korean, 0.4% Chinese and 0.6% Other (in 2011). One of those “other” is now Geoffrey Clark, one of our guest bloggers. He has just moved to Japan for work and will be returning to blogging soon.

Japan really had not relied on immigration as part of their response to declining population. This is also unusual. As a result their demographic “pyramid” has developed a really uncomfortable shape. This is about as close as you are going to get to just flipping the pyramid upside down.

In the bigger picture, this shows the impact of controlled de-population on a country’s demographics (and economy). This is the alternative to allowing large scale immigration. Every country will need to address this as their fertility rates drop below 2. It is estimated that in 2050 the population of Japan will be 109 million (2017 UN figures, medium variant). This compares to 402 million for the United States (or 396 million using the 2017 UN medium variant figures). Right now the per capita income of Japan is $38,440 compared to $59,501 for the U.S. (IMF 2017 figures). If the per capita income remains below the United States, then this means the GDP of Japan could well decline to being below a fifth of the United States. This is a very different picture than the estimates that they would economically surpass the U.S. in 2020.

Final thoughts:

                 Japanese             United States           Ratio

Year          Population          Population                U.S./Japan

1860          > 32 million           31 million                  0.97

1900             44 million           76 million                  1.72

1940             73 million            132                          1.64

1980           117                       227                          1.94

2020           127                       334                          2.63

2050           109                       396                          3.63


1860 was 7 years after Commodore Perry entered Edo Bay, which lead to the opening of Japan for trade.

1900 was when the U.S. and Japan were on good terms.

1940 was the year before Pearl Harbor and the U.S. and Japan went to war.


Demographics of India

India is still not thought of by many as a world power, but in the long run, as its economy and population grow, it will join this esteemed company. It is the 2nd largest population in the world and the 6th largest economy in the world. Its economy is about the size of its old colonial master, the United Kingdom. It is a nuclear power, although we gather it has not weaponized many nukes. Still, it is a poor country, with a per capita income of $1,983 per person (per year…IMF 2017 figures).

Unlike China, there was no draconian one-child policy adopted, so Indian population continued to grow at a rate that is about to catapult it past China as the most populous country in the world. This is expected to happen in 2024 or 2030, or whenever. Sometime in the next decade.

The population of India for 2017 is estimated at 1.324 million, or 1.3 billion. This puts the population of the world’s largest democracy around four times that of the United States. It is almost four times what its population was in 1951 (361 million). In the early 1950s China had a population around 60 percent larger than India. Now, they are almost equal, although China has considerable more wealth.

The rapid Chinese economic growth has lead to it having a GDP of $12 trillion compared to the more anemic GDP of India at only $2.6 trillion. Needless to say, there is also a big difference in per capita income.

But while China is growing at a rate of only .59% a year and its population is expected to fall, India is expected to continue growing. Its growth rate in 2016 was 1.19% and its fertility rates are 2.45 children per woman (2016 estimate from CIA World Factbook). The annual growth rate remains at over one percent a year. But, the growth rate of the population appears to be declining, like it is in most areas of the world, developed or developing. India does have some emigration and immigration, but the population is so massive that this does not have a huge impact on population growth rates. The demographic pyramid is actually much more pyramidal that the others we have seen, although it is clear towards that bottom of the pyramid that they are now controlling their population growth rates.

India is truly a multi-ethnic, multi-linguistic and multi-religious society. It has something like more than 2,000 ethnic groups. Forgive me if I don’t list them. About 40% of Indians speak Hindi (an Indo-European language) as their first language, and over half the population can speak it. Over 10% of the population speaks English, making it the second largest English speaking country in the world. Religious affiliation is a little more unified with Hindu’s making up almost 80% of the population. There are Muslims (14% or more), Christians (2.3%), Sikhs (1.7%), Buddists, Jainism and even practitioners of Zoroastrianism (look that one up in your Funk and Wagnells). Keep in mind that 14% of 1.3 billion makes this the third largest Muslim population in the world with over 170 million Muslims.

The Indian population is expected to grow for a while. The United Nations predicts the Indian population will be 1.7 billion in 2050. This compares to 402 million for the United States and 1.36 billion for China estimated in 2050.

India economic growth rate has been around 6% a year for the last two decades. Depending on continued economic growth, this is a country that will slowly and surely take its place among the nations of the world.


Demographics of China

China is the most populous country/region in the world. In its unified and un-unified forms, it has been forever, so it seems. It certainly has been since the fall of the Roman Empire, although one can argue that the British Empire was larger for a moment. Oddly enough, the pre-eminent position that it has held for over 1,500 years, is about to be surpassed by India. China, in its wisdom brought it population under control decades ago, encouraging smaller families. This has allowed it to further develop and economically grow. Quite simply, if a country’s economic growth is 3% a year, and its population growth is 3% a year, then the average person is basically getting nowhere. This has been the case for many nations in the developing world. China has broken from that pattern.

The population of China (People’s Republic of China) for 2017 is estimated at 1,411 million, or 1.4 billion. This is a staggering figure making it almost five times (4.6 times) as many people as the United States. It is around three times what its population was in 1950. The population in its first official national census taken by the People’s Republic of China in 1953 was 583 million. It was a little hard to determine what the population of China was until the post-war period. Post-war in this case means post-Warlord period, post-Sino-Japanese War, post-World War II and post-Chinese Civil War. The Chinese population was almost four times larger than the United States in 1950/1953, back in the days when we were at war with China in the Korean peninsula. The Chinese population is now growing at a rate of 0.59% percent a year (a half percent a year). This is very low.

The fertility rates in China are 1.62 children per woman (2016) according to National Health and Family Planning Commission (NHFPC) and 1.29 in 2016 according to the National Bureau of Statistics (NBS). Not sure why there is such a difference. Regardless, this is not replacement rate and well below 2.1. It is a birth rate lower that what we see in many developed countries, although China is a still a developing country. This low birth rate was a result of the one-child policy instituted by the Communist Party in 1979. It appears to have not only worked, but it worked too well. In 2015, the government instituted a two-child policy. According to NHFPC, they are expecting the birth rate to grow to 1.8. I guess this is one of the goals of the 13th Five-Year Plan. This is still not replacement rate. China does have some emigration and immigration, but the population is so massive that this does not have a huge impact on population growth rates.

They have classified 91.51% of the population of China as Han Chinese. Still, 8.5% of 1.5 billion creates some significant minorities. This includes the Tibetians, with at least 2.8 million, and the Turkish Uyghurs estimated at 3.6 million. I ate recently at a Uyghur restaurant in Crystal City, VA. I have never seen to one of those before.

Most likely the Chinese population will experience negative population growth by 2030. The United Nations predicts the Chinese population will be 1.36 billion in 2050. This compares to 402 for the United States and 132 for Russian in 2050. Predicting population over 30 years is not that difficult. On the other hand, there is a projection that Chinese population will decline to 1.02 billion by 2100. I would not hang my hat on that last figure.

The population is aging, with its demographic “pyramid” developing a narrowing at the bottom. The demographic “pyramid” from 2015 is below:

These figures do not include Taiwan (Republic of China) or Macau (Macao Special Administrative Region). It does include the city of Hong Kong. Mainland China claims Taiwan is part of China and has had an army posed across the straights ready to invade for almost 70 years. I am guessing if they have not invaded in the last 70 years, they are not going to invade in the next 70, especially as Taiwan is a major trading partner. I do not expect re-unification as long as Taiwan remains democratic (and it has been since 1991/1996) and China remains a communist dictatorship. Taiwan had a population in 2010 of 23.1 million, and it is growing only very slowly. Macau, with a population of 552,300 in the 2010 census, is effectively under Chinese control, as is Hong Kong (7,097,600 in the 2010 census).

Demographics of the United States

The United States is the third most populous country in the world, and has been since the collapse of the Soviet Union. It is likely to remain the third most populous country for a long time to come, as it will certainly not catch up to the two countries with over a billion people (China and India) and will not be surpassed by anyone else any time soon (Indonesia, 4th on the list, has a population of around 264 million in 2017 and a growth rate of 1.1% compared to the U.S. growth rate of 0.7%). It appears that we will be the third most populous country in the world for decades to come.

The United States population for 2018 is estimated at 328.3 million. This is more than twice what it was in 1950. It has been growing at 9.7% or higher for every decade since 1790, with the exception of the 1930s (7.3% for that decade). Annual growth rate in 2017 is 0.7%.

The fertility rates in the U.S. is 1.76 children per woman (2017). This is not that much higher than the 1.61 figure that Russia has (see my previous post on demographics). Almost all developed countries in the world now have a birth rate below 2. It needs to be around 2.1 to achieve replacement rate. The U.S. fertility rate dropped below 2.1 in 1972 and has remained below the replacement rate ever since then, except for two years (2006 and 2007). But, the U.S. population continues to grow, and that growth is due to immigration. If it was not for immigration, the U.S. population would be in decline.

The United States is currently 77.7% “white” (in 2013), which is defined by the census bureau as “having origins in any of the original peoples of Europe, the Middle East, or North Africa.” Non-Hispanic “whites” make up 62.6% of the country’s population. The non-Hispanic “white” population is expected to fall below 50% by 2045. Needless to say, this has become a political issue inside the United States, one that I have no interest in discussing on this blog. See: https://www.brookings.edu/blog/the-avenue/2018/03/14/the-us-will-become-minority-white-in-2045-census-projects/

The United Nations predicts the U.S. population will be 402 million in 2050  (compared to their prediction of 132 for Russia in 2050). The U.S. census bureau projects the U.S. population will be 417 million in 2060.

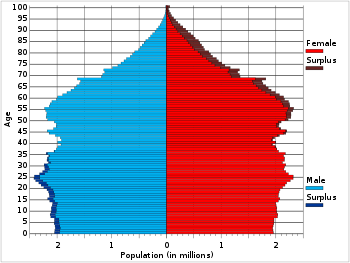
The population has gotten older, with the median age now being 38.1 years. In 1970, at the height of the “youth culture” it was 28.1 years. The demographic “pyramid” from 2015 for the United States is below. This is worth comparing to the Russian “pyramid” in a previous post.

The legal immigration rate of the United States has averaged around 1 million a year from 1989. The legal immigration rate rose to 1.8 million in 1991 and was 1.2 million in 2016. This was very much driven by the Immigration Act of 1990, which raised the cap on immigration. See: https://www.dhs.gov/immigration-statistics/yearbook/2016/table1

The illegal immigration rate is harder to calculate, as some illegal immigrants are deported, some return home and I gather a significant number of them later convert to legal immigrants. It is estimated that there are around 11 million illegal immigrants in this country (2016 estimate). In 1990, it was estimated that there were 3.5 million illegal immigrants. Does that mean that the actual immigration rate from illegal immigration is less than 300,000 a year (as many later become legal immigrants)? It is hard to say exactly, but it appears that our immigration rate is somewhere between 1,300,000 and 1,500,000 a year counting both legal and illegal immigrants.

This is the primary source of our population growth and will probably be so for some time to come. The United States ceased reproducing at replacement rate almost 50 years ago. This is not going to change anytime soon. Some immigration is probably essential to maintain our labor force at current or growing levels (this is as close to a political statement as I am going to get on the subject).

Next to China, India, Japan and Germany.

Demographics of Russia

I am far from an expert on demographics, but it something I do occasionally pay attention to. When it comes to measuring long-term military power and world influence, the basic measurement of power is wealth times population. Or, you can simply stack the countries up by GNP. This puts Russia 11th on the list, below Canada. But looking at Russia’s population alone is useful.

As of January 2018 the population of Russia is estimated at 146.9 million people. This does make it the 9th most populous country on the planet. This does include Crimea and Sevastopol, which has 2.4 million people.

The population of Russia was in steady decline from 1991 to 2013. Even in 2017 Russia was only producing 1.61 children per women. This is below the replacement rates of 2.1. The last time the Russian fertility rate was above 2 was in 1989 and that was only for 7 years. It was below 2 for most of the time before that going back to mid-1960s. Low child birth rates and small families rates seem to be very much a part of the culture. I know a lot of Russians that are only children.

Their population is growing ever so slowly due to immigration. For 2017 they had a net migration of 211,878, and a natural population loss of 135,818. This gave them population gains of 76,060, which is a very small annual gain (0.05% gain a year). In 2010, ethnic Russians made up 77% of the total population.

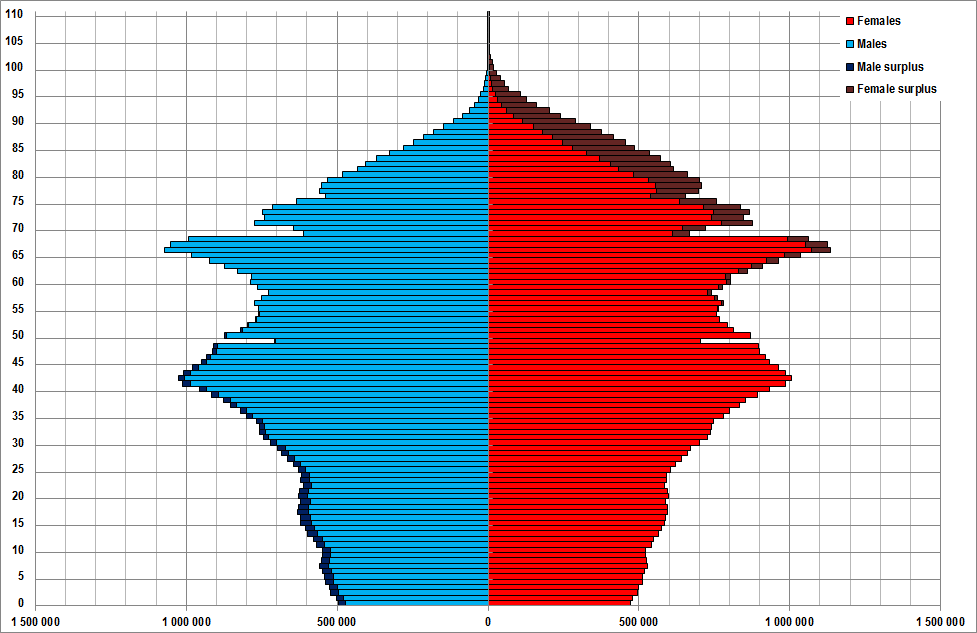
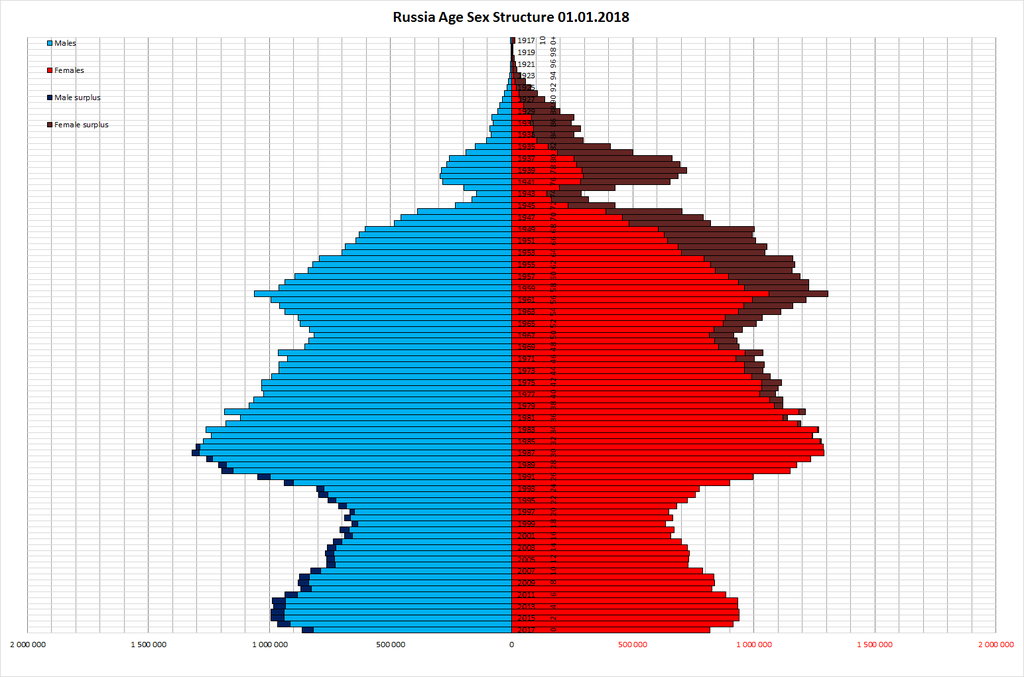
The population of Russia was 147.4 million in 1990, 148.7 million in 1991, and then it declined at a rate of 0.5% a year, dropped to 142.9 million in 2010 and has increased to 146.9 since then by immigration and seizure of Crimea and Sevastopol. In 2006 the Russian government started simplifying immigration laws, encouraging immigration of ethnic Russian from former Soviet republics. There is probably a limit to how many more people this can draw in. Russia also has about 7 million temporary migrant workers (these are 2011 figures). The Russian population tends to be older than most. The demographic “pyramid” is anything but pyramidal in shape.

As of 2018, the UN is still predicting that Russia’s population will fall to 132 million by 2050. See: https://esa.un.org/unpd/wup/Country-Profiles/

Now, lets compare the population of the Soviet Union/Russia to the United States over time:

                Soviet Union/Russia               United States

1951        182.3 million                             151.3 (1950)

1959        209.0                                        179.3 (1960)

1970        241.7                                        203.2

1977        257.7                                        226.5 (1980)

1982        270.0                                        226.5 (1980)

1990        290.9                                        248.7

1991        293.0                                        248.7 (1990)

2002       145.2 (Russia only)                   281.4 (2000)

2010       142.9                                         308.7

2018       146.9                                         328.3 (est.)


So, during the height of the “we will bury you” era the Soviet Union had a population of about 20% larger than the U.S. Russia now has a population less than half the U.S. (and a GDP of less than Canada). It appears that their population will not be growing very fast and may well continue to decline.