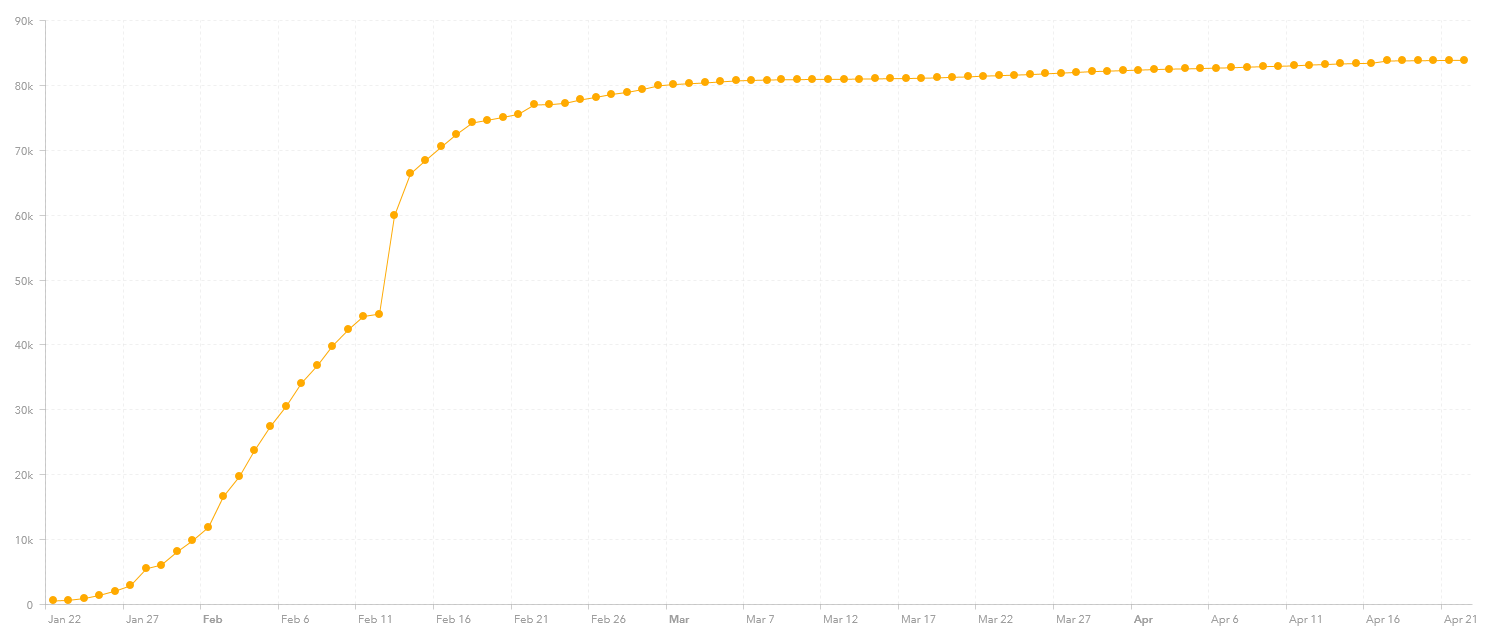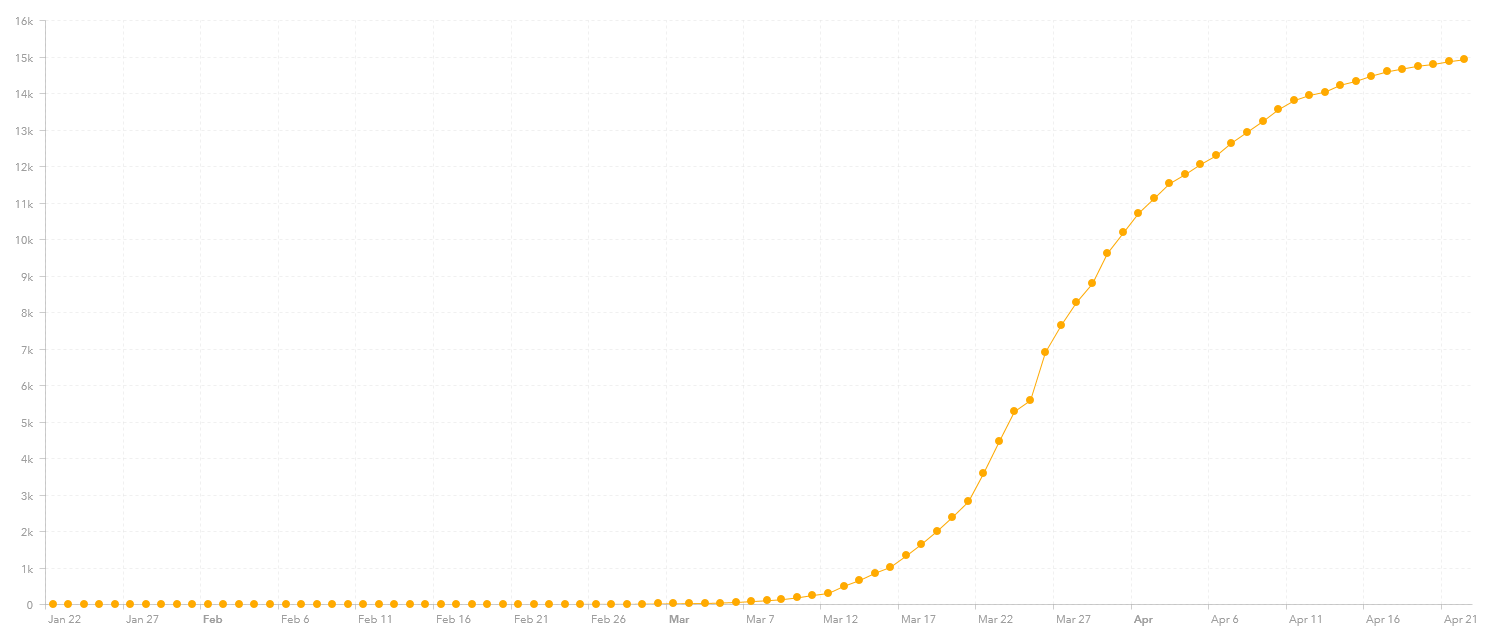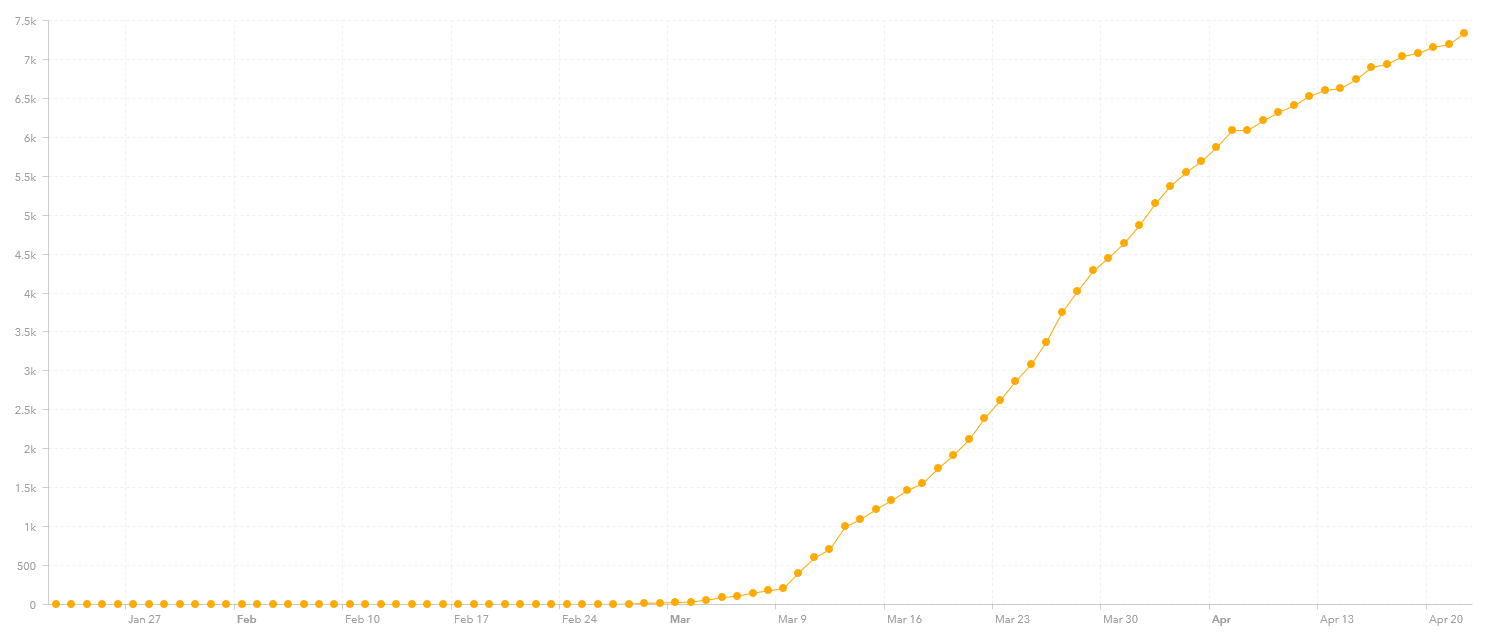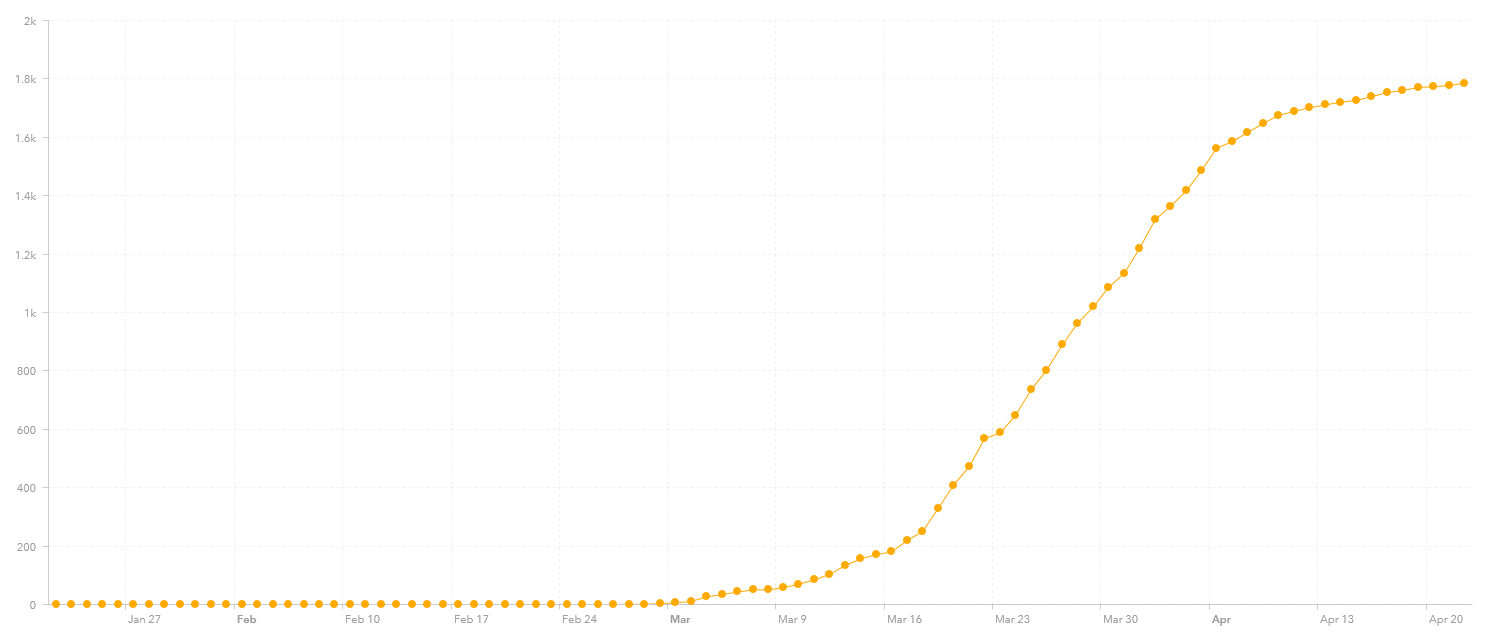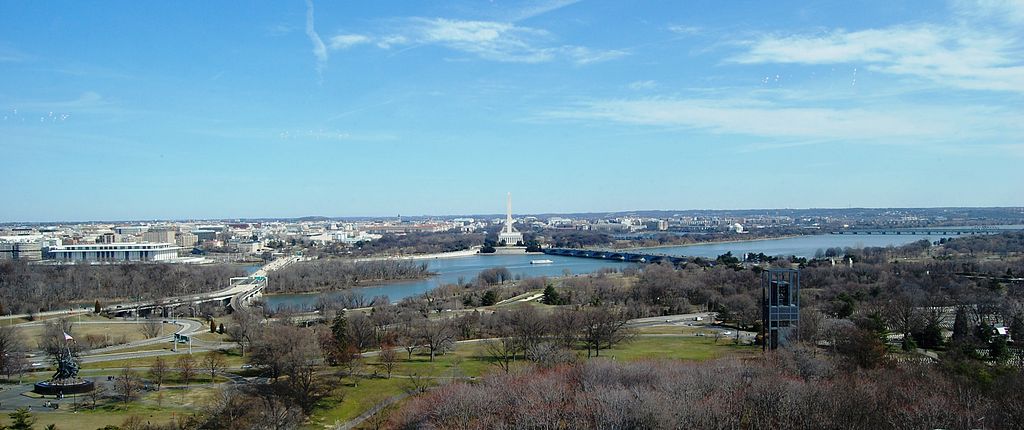
As I live and work in Northern Virginia, just a few miles outside of Washington, DC, the local situation is of interest to me, as I suspect it is to a few other readers. I will be maintaining these updates on Wednesdays for a while. Again, all the data is from the Johns Hopkin’s website (which I gather is also maintained in the DC area), as of 3:32:46 PM: Johns Hopkins CSSE
The DC area is rather sprawling, with over 5 million people scattered across DC, Virginia and Maryland. Let me list the presence of virus by location. I list the number of cases from last week followed by the number of cases this week and then the current number of reported deaths. Population is the 2018 estimate from Wikipedia:
……………………….….Population…last week…this week.…Deaths
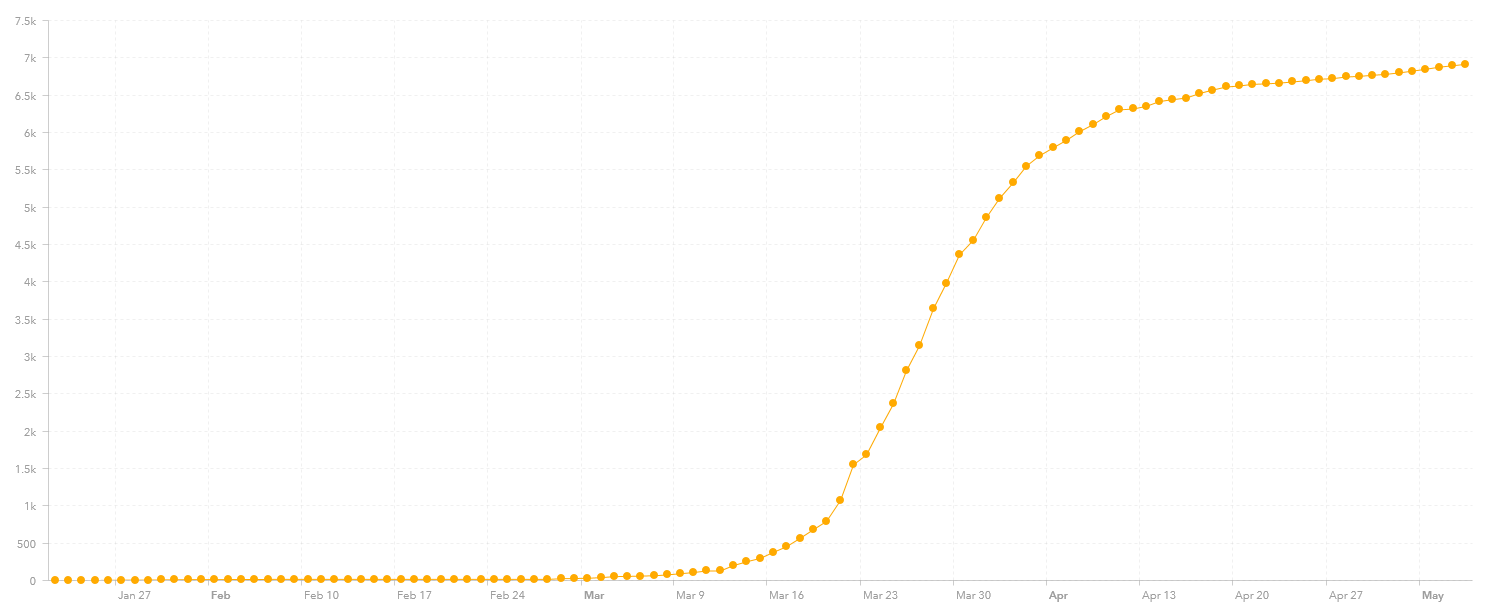
Washington D.C…………..702,445…..6,584………7,551……….407
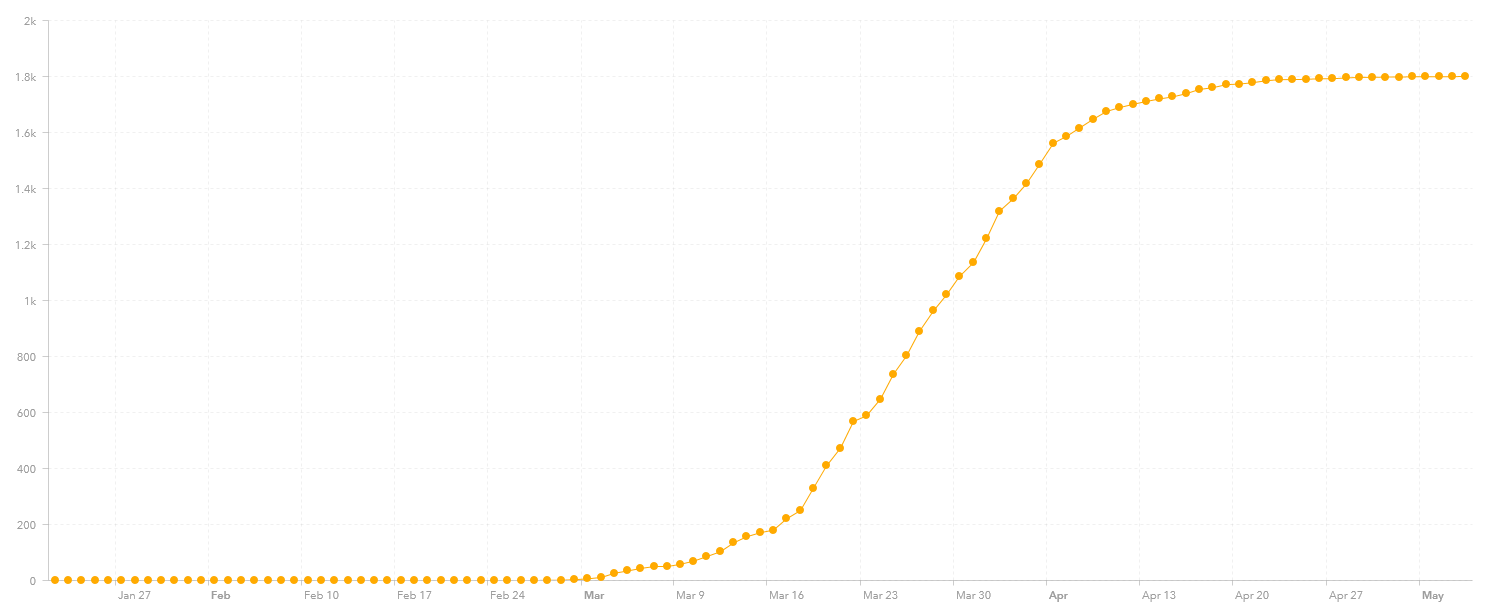
Arlington, VA…………..…..237,521…..1,416………1,728…….….81
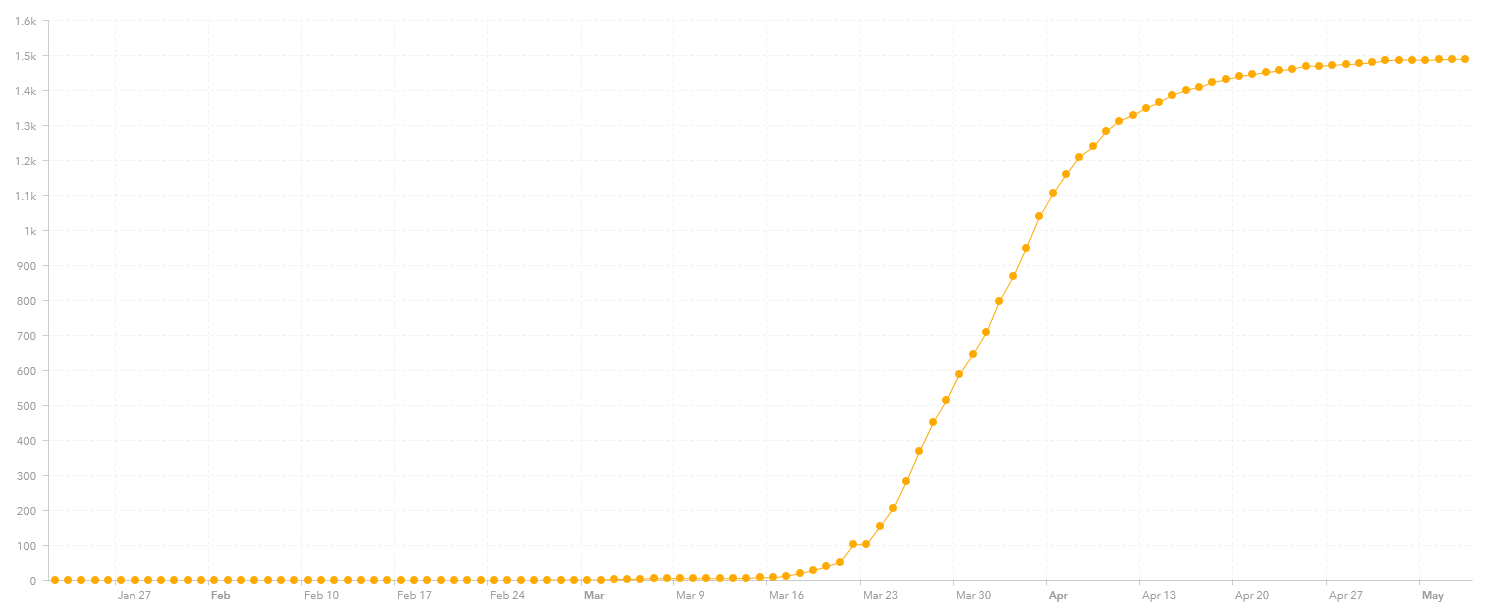
Alexandria VA………….…160,530……1,240………1,577…….…34
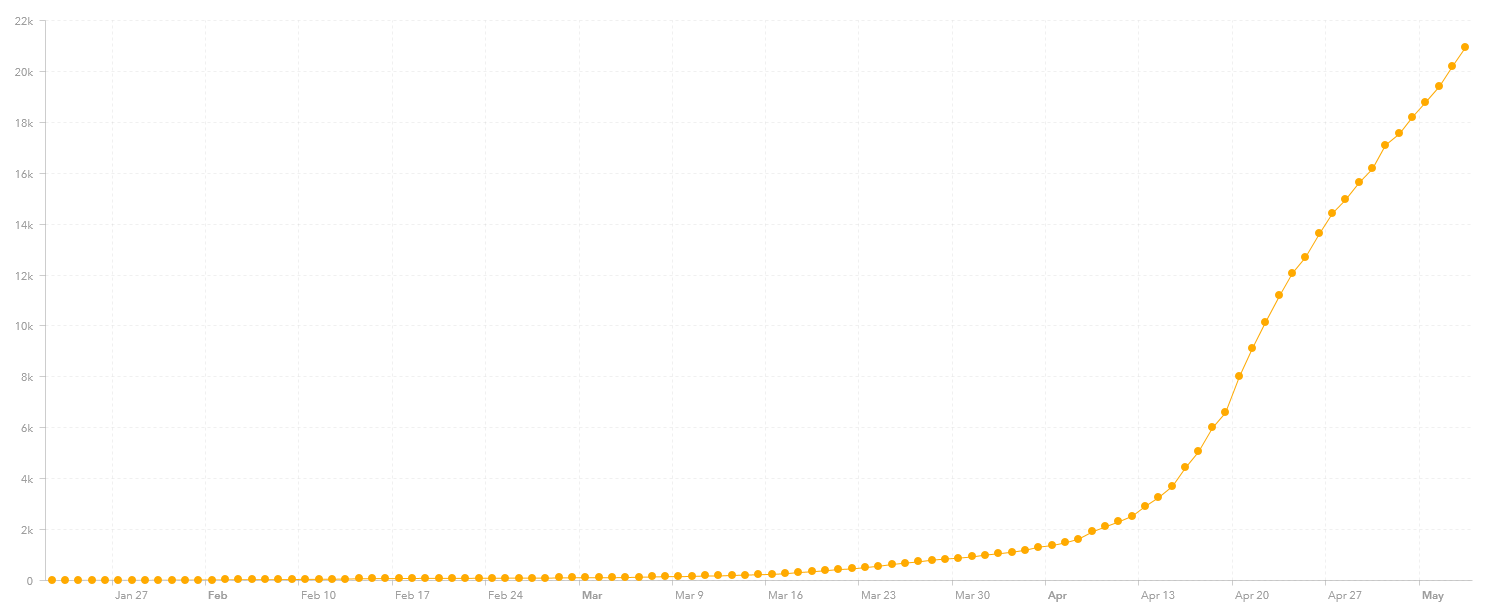
Fairfax County, VA……..1,150,795……6,470……….8,163……..302
Falls Church, VA……..…….14,772………..37…………..44……..….5
Fairfax City, VA……..………24,574……..…40……….…47…………3
Loudoun County, VA………406,850…..1,210………1,579…..…..49
Prince Williams C., VA….…468,011…..3,078………4,054…….…79
Manassas…………………….41,641…..…430…………699…….….6
Manassas Park………….…..17,307…..…139……….…207………..3
Stafford Country, VA………149,960………396………….514……….4
Fredericksburg, VA…….…..29,144…………66………….101……….0
Montgomery C., MD….…1,052,567……..7,283………9,052…….515
Prince Georges C., MD….909,308….…10,072……..12,446…….453
Total……….…….…….…5,365,425…….38,461……..47,762….1,941
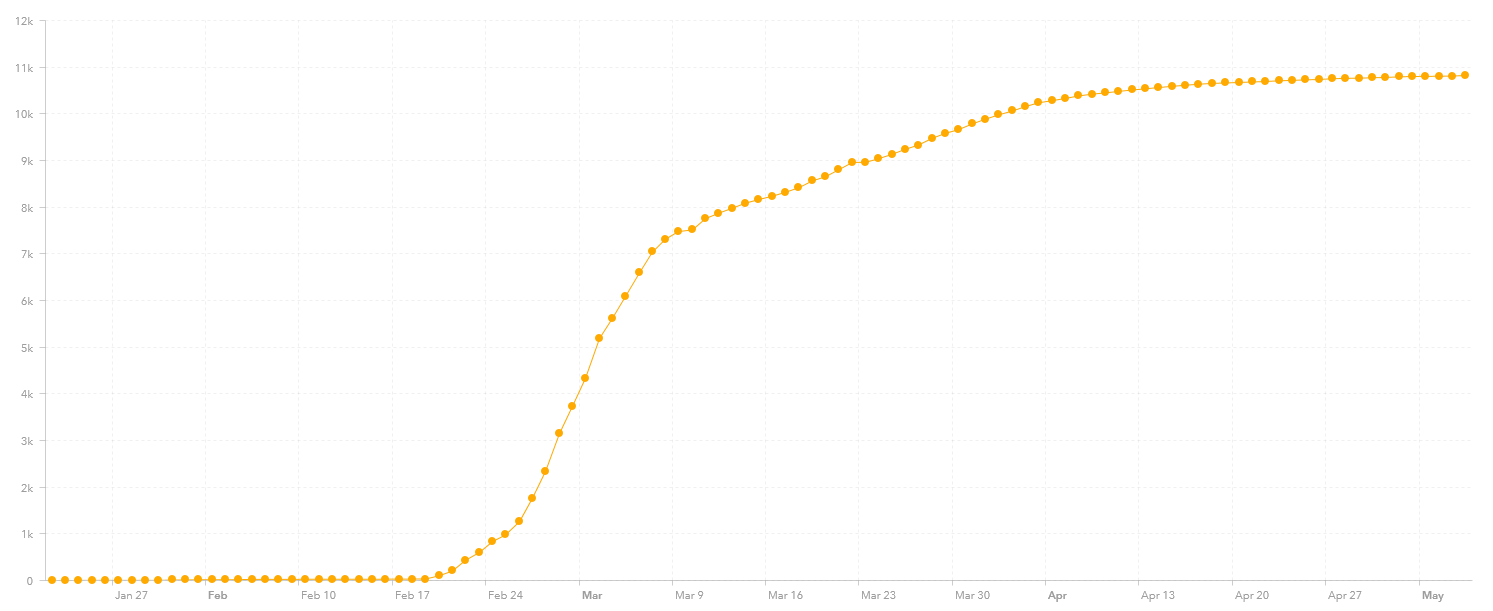
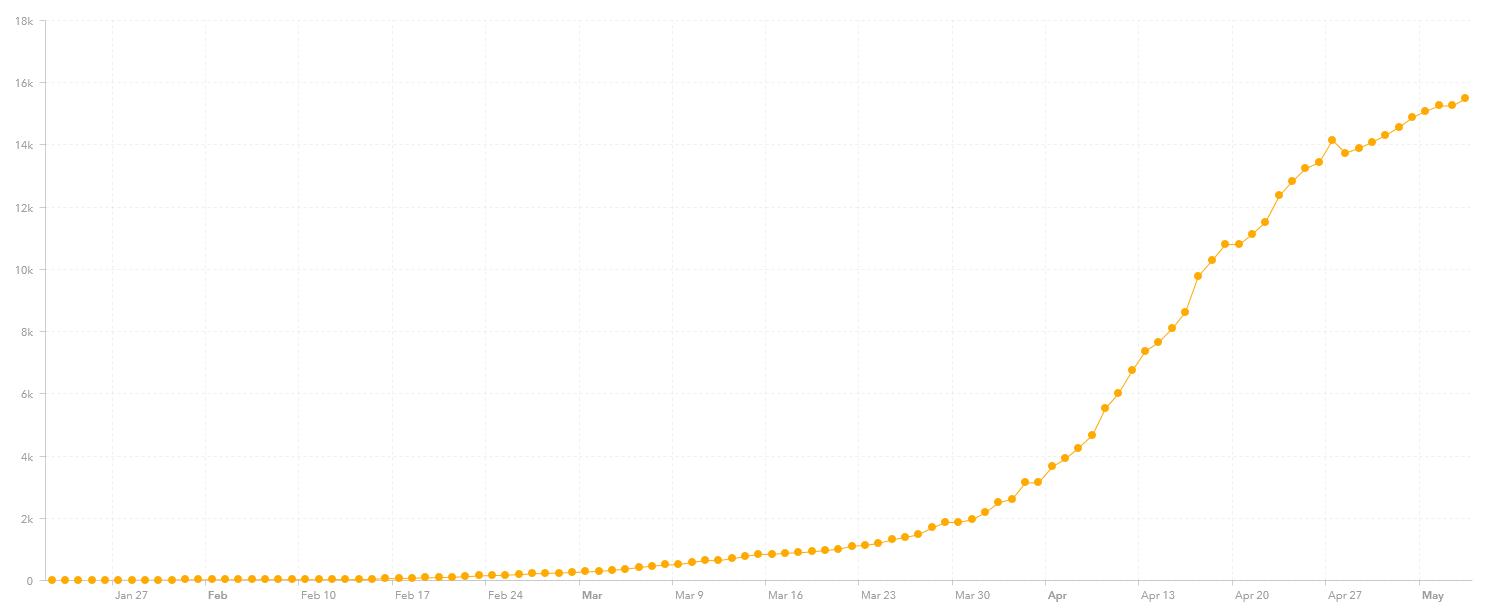
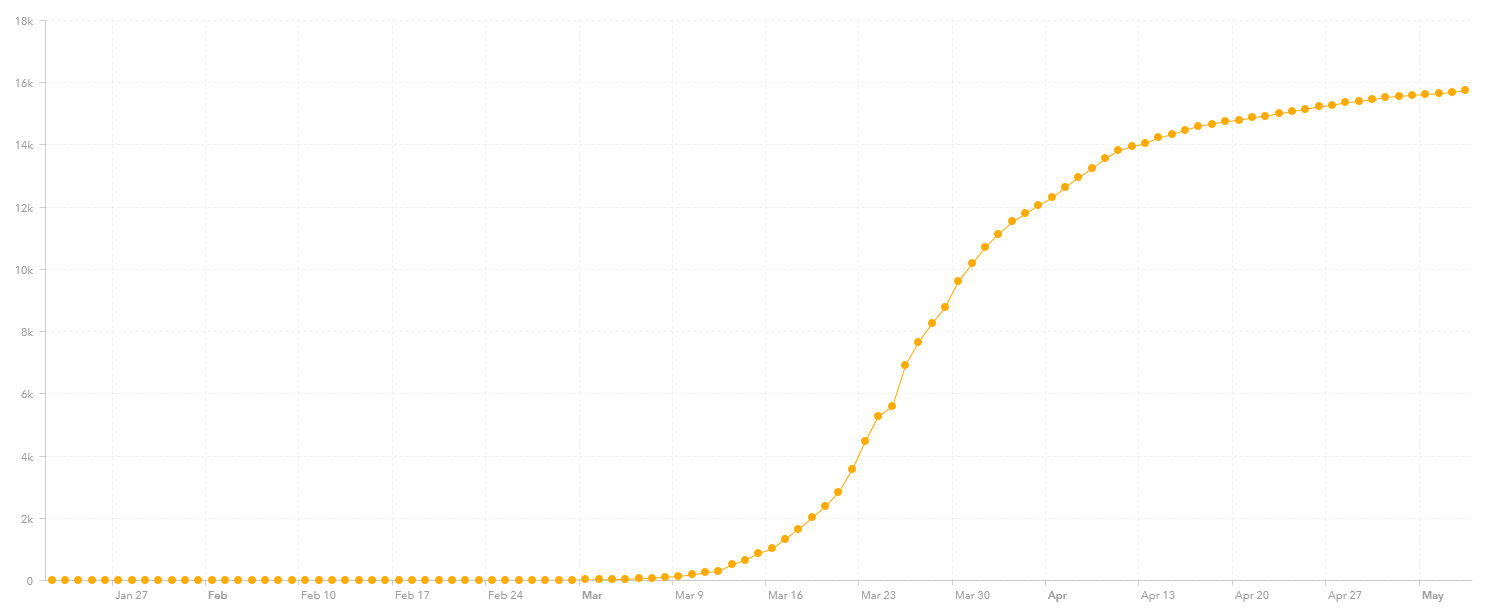
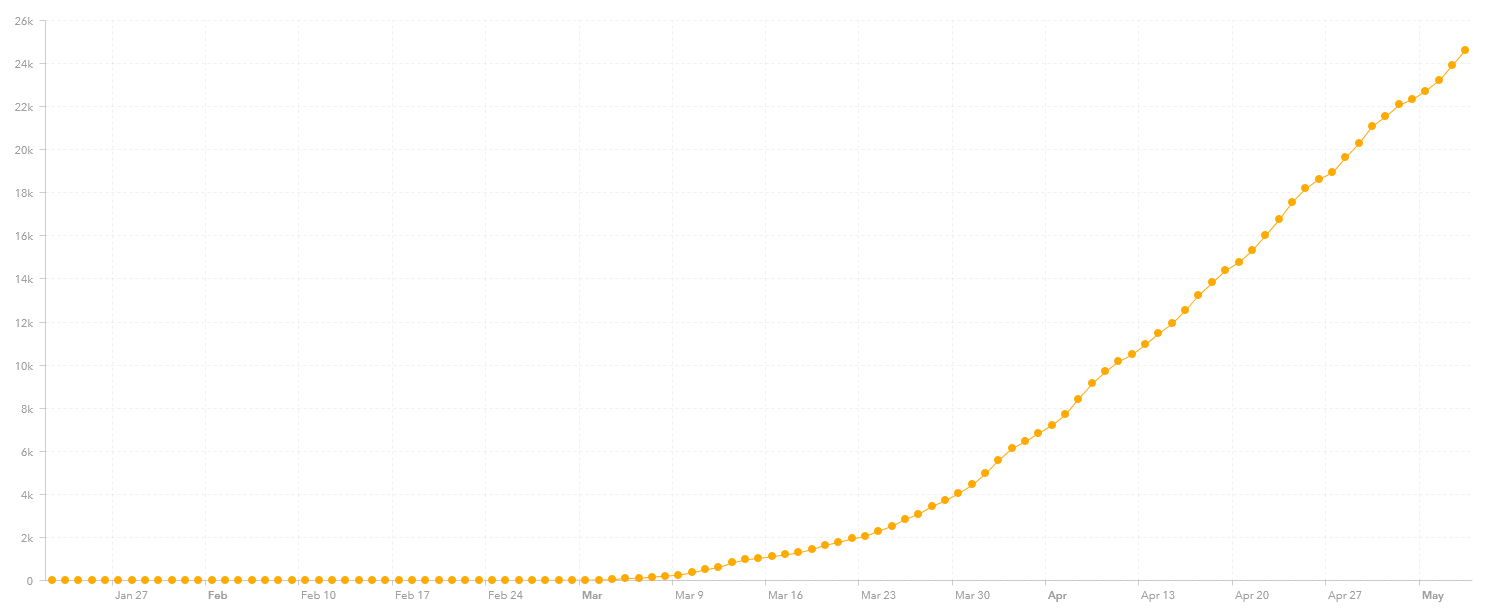
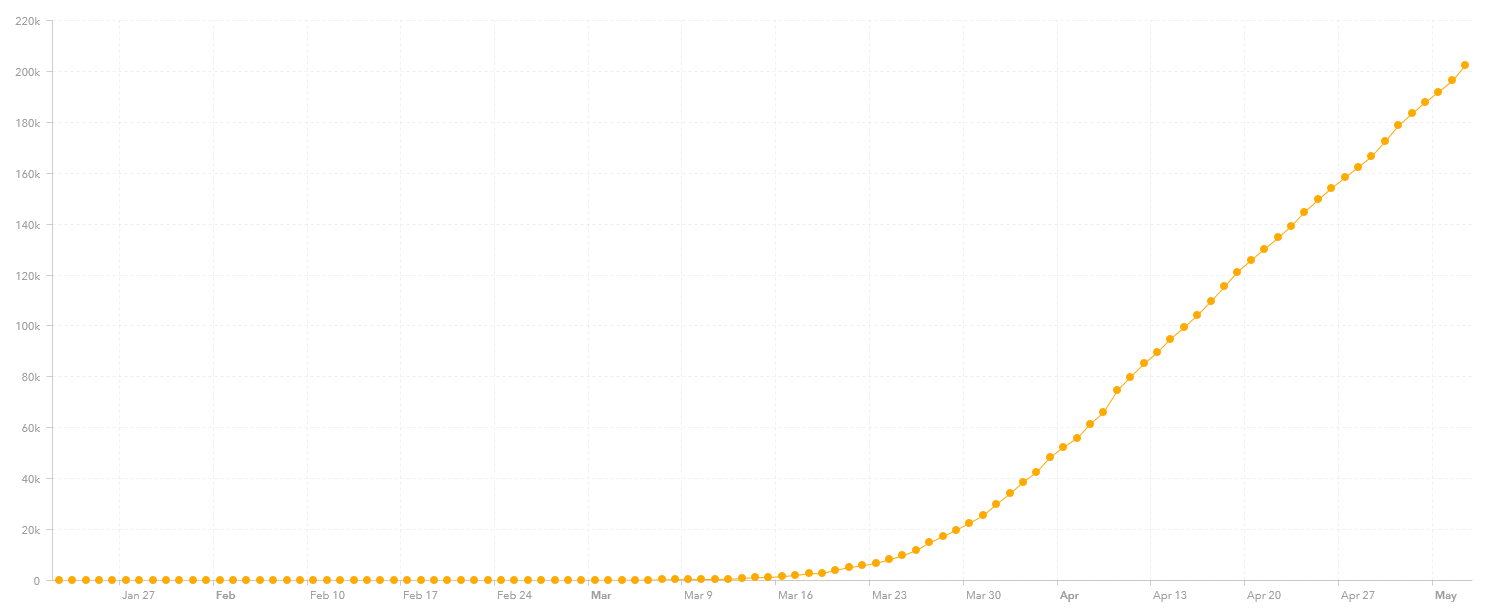
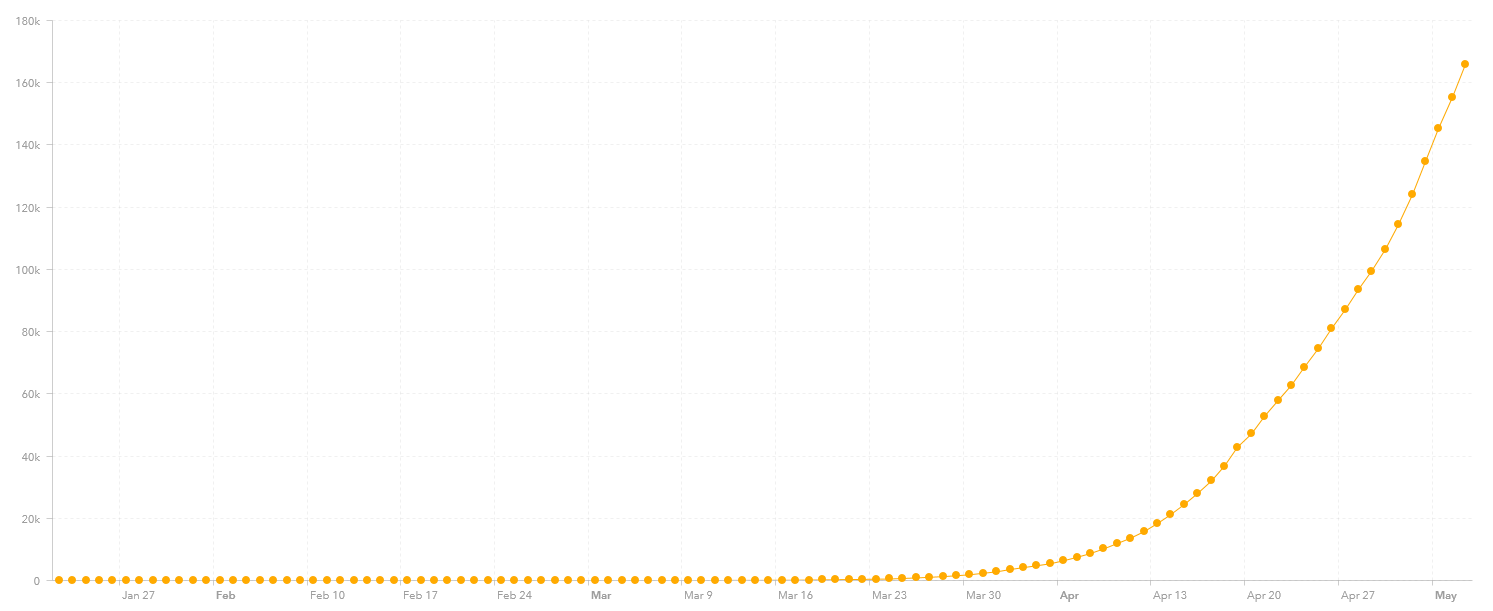
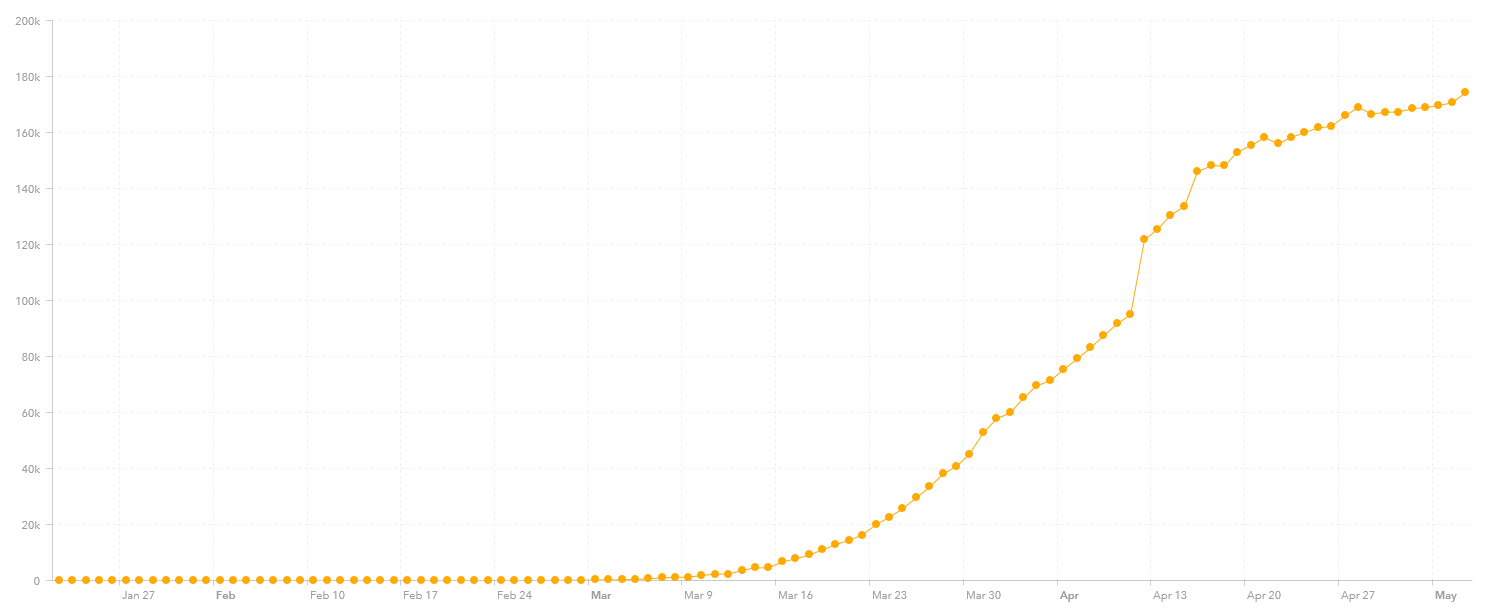
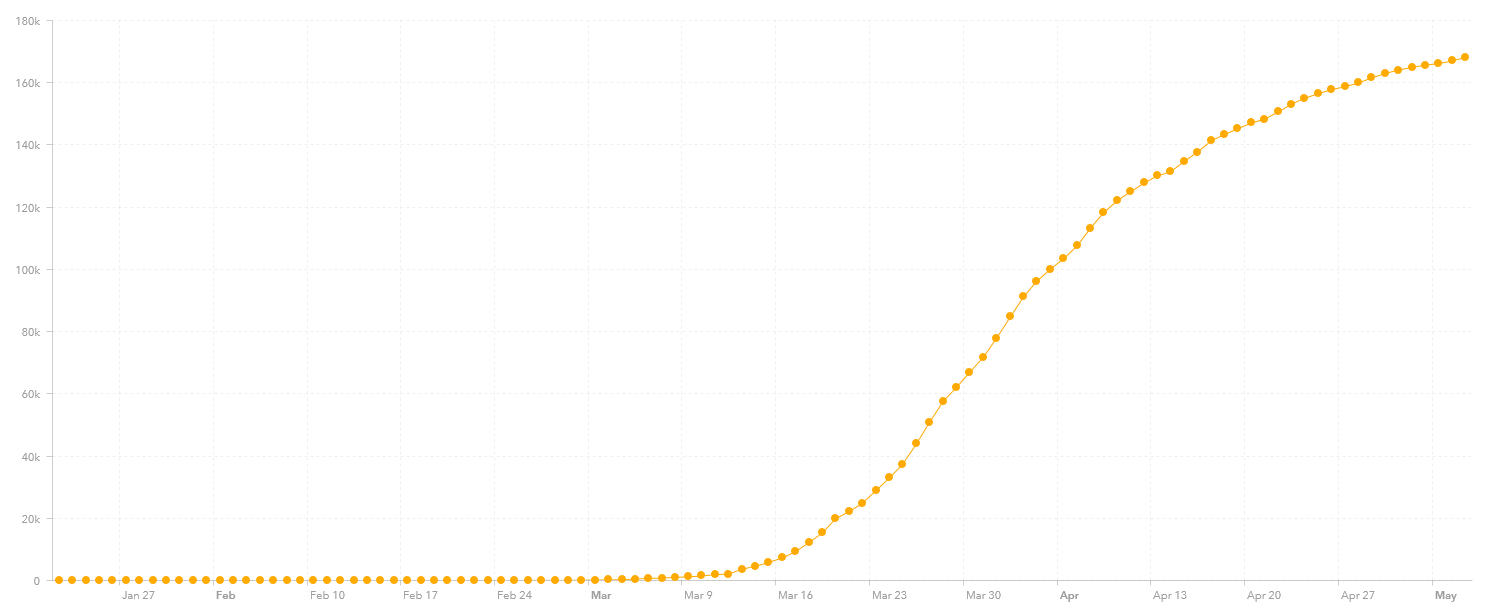
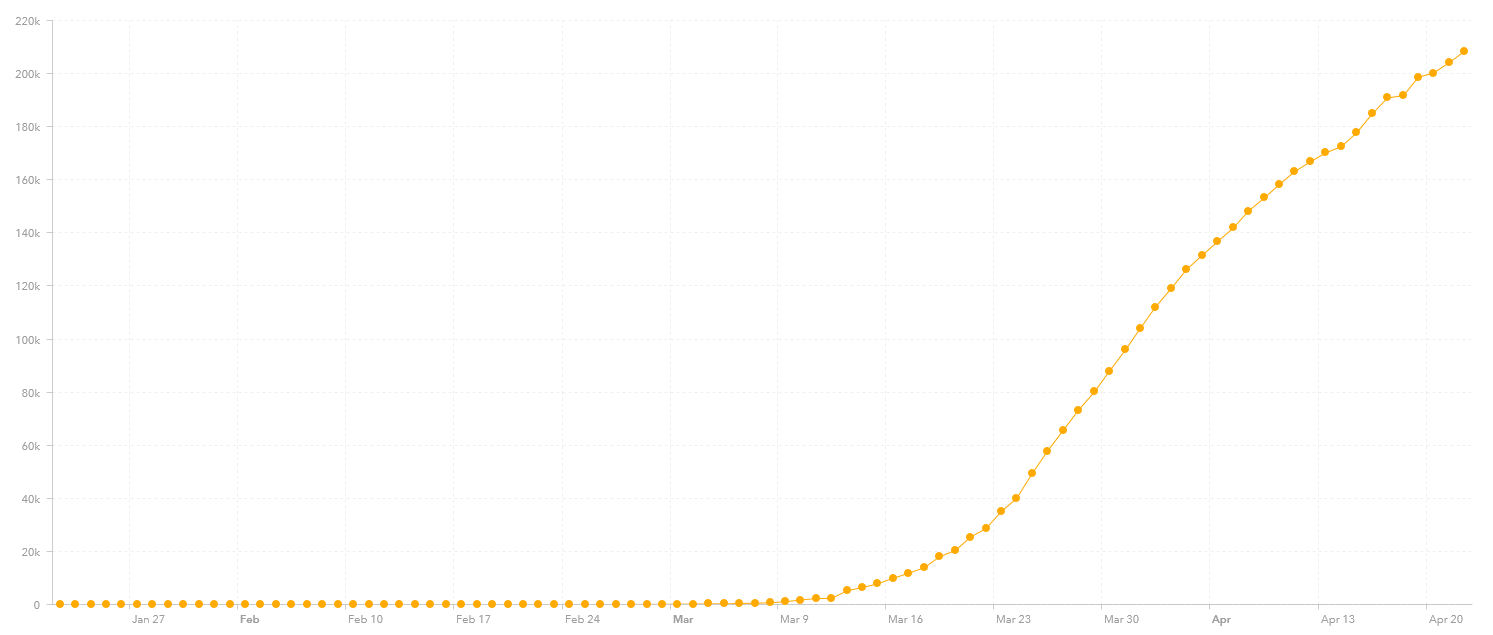
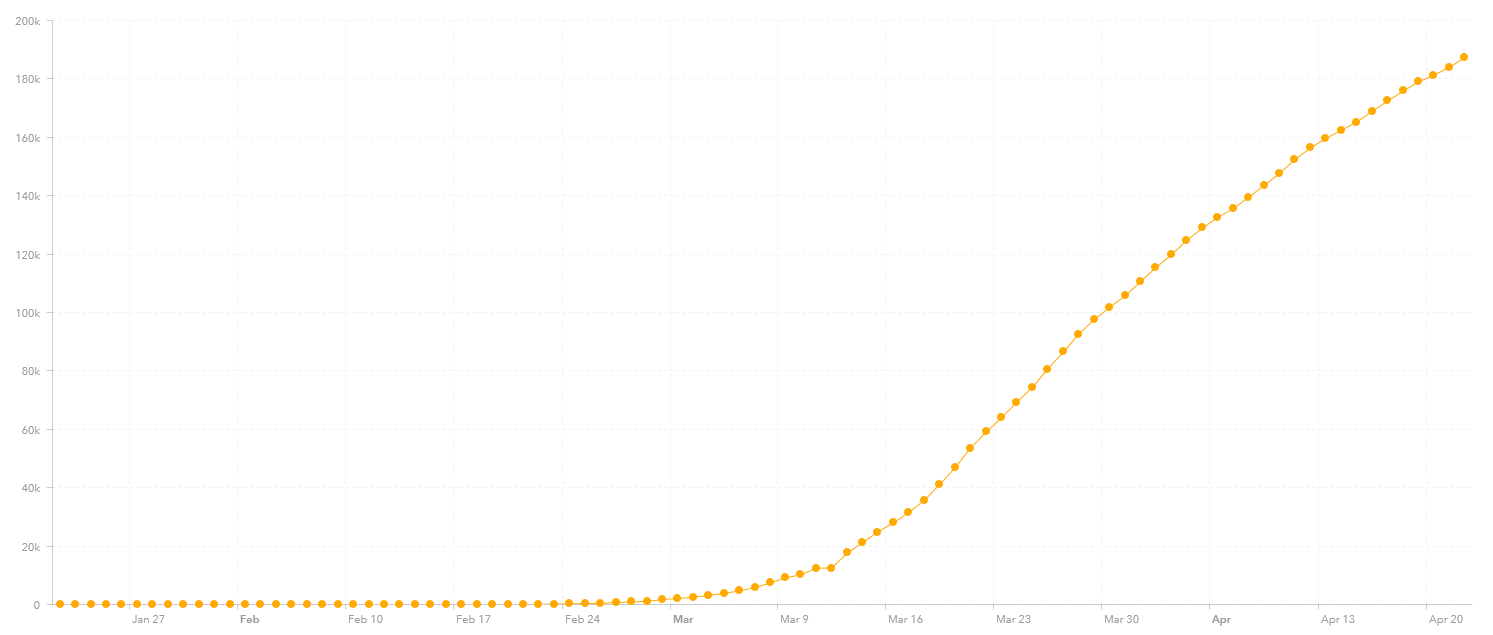
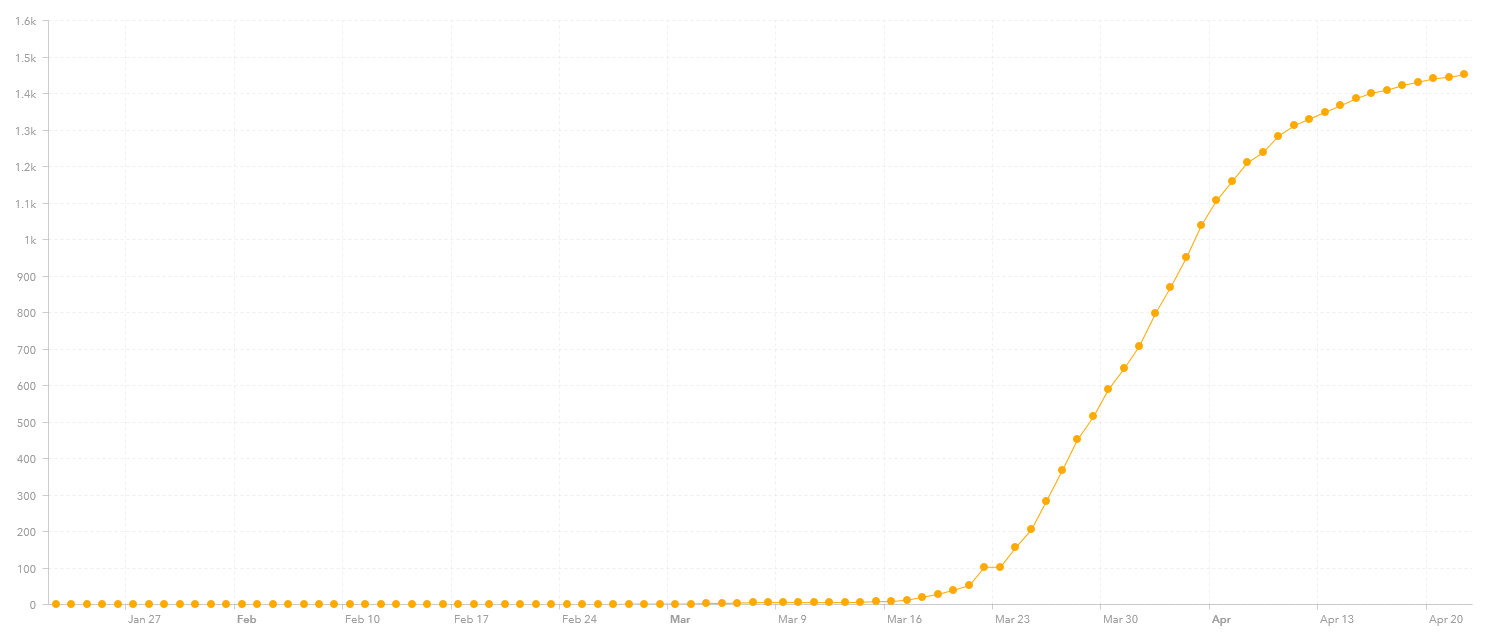
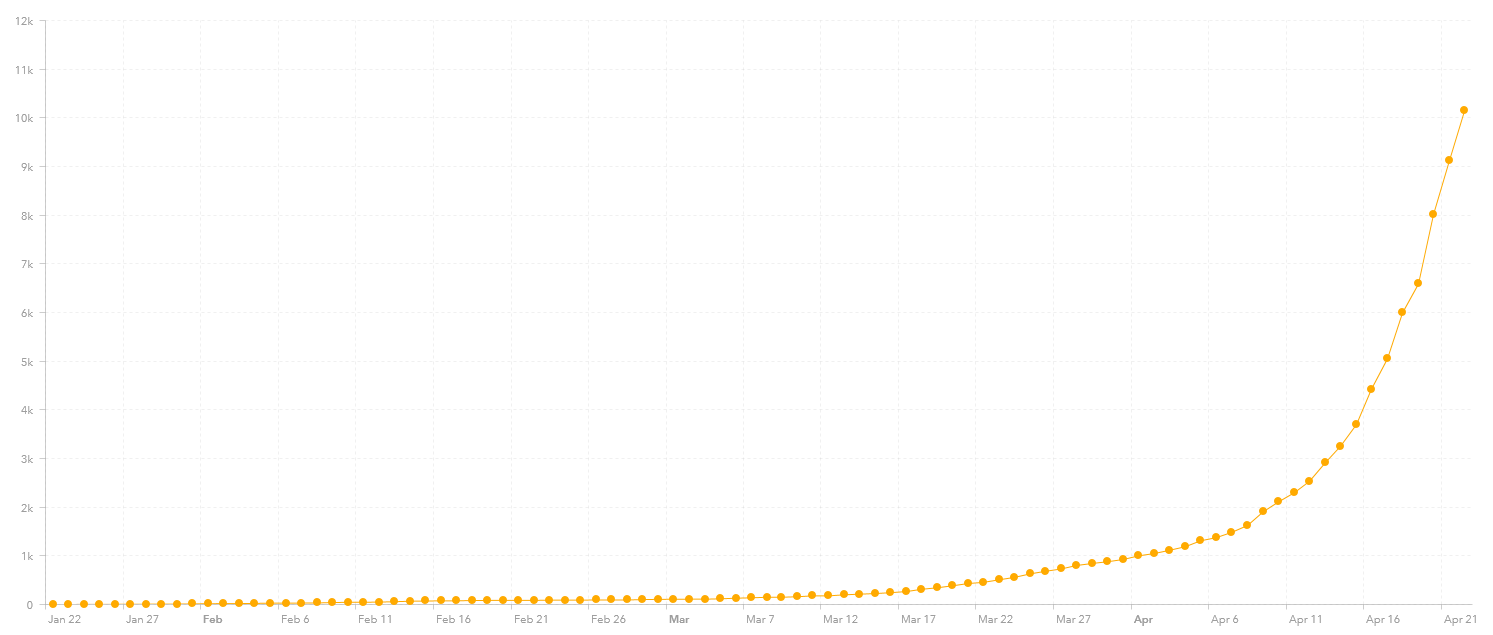
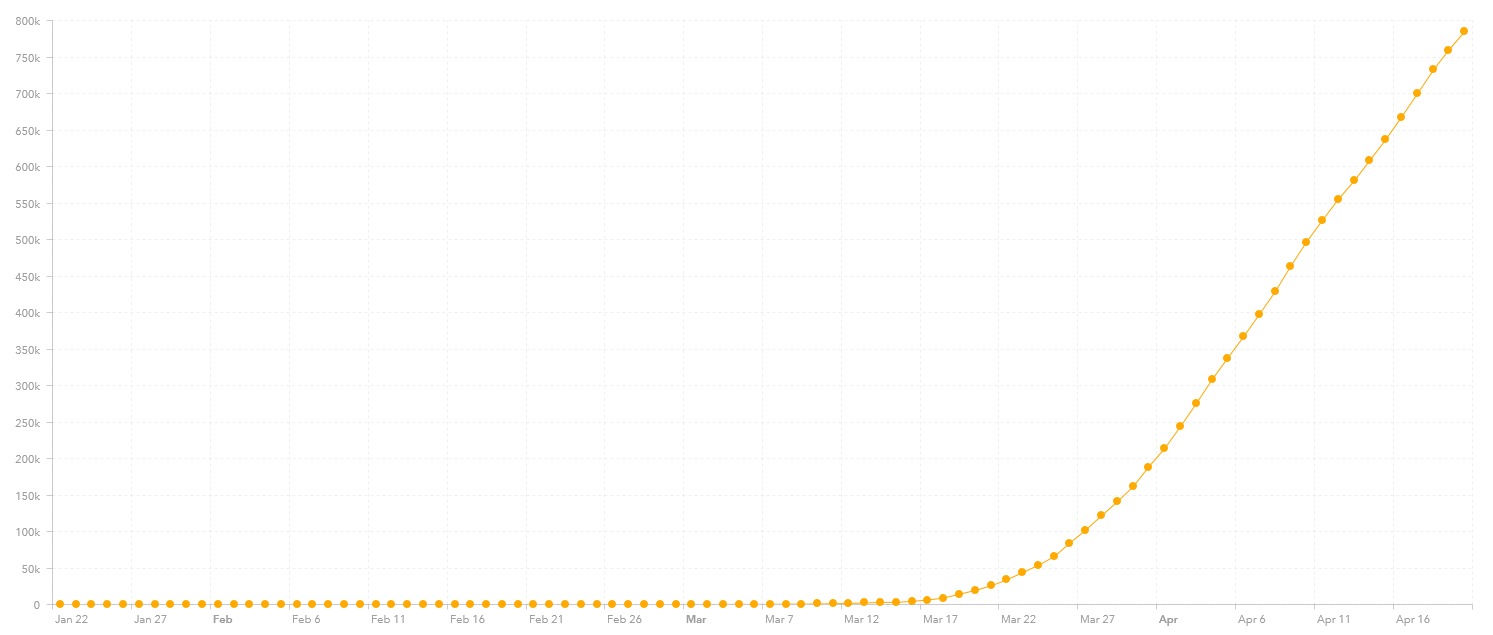
The number of cases was doubling at every locale each week for the first three weeks I was tracking this. Four weeks ago it only went up by a little more than half (actually 58%), three week ago went up by half (actually 50%), two weeks ago it went up less than half (actually 39%) and last week it went up only 27%. The week not much progress. the number of cases went up 24%. The actual number of cases went up 9,301, compared to 8,200 new cases last week and 8,547 new cases the week before that. This really is not under control.
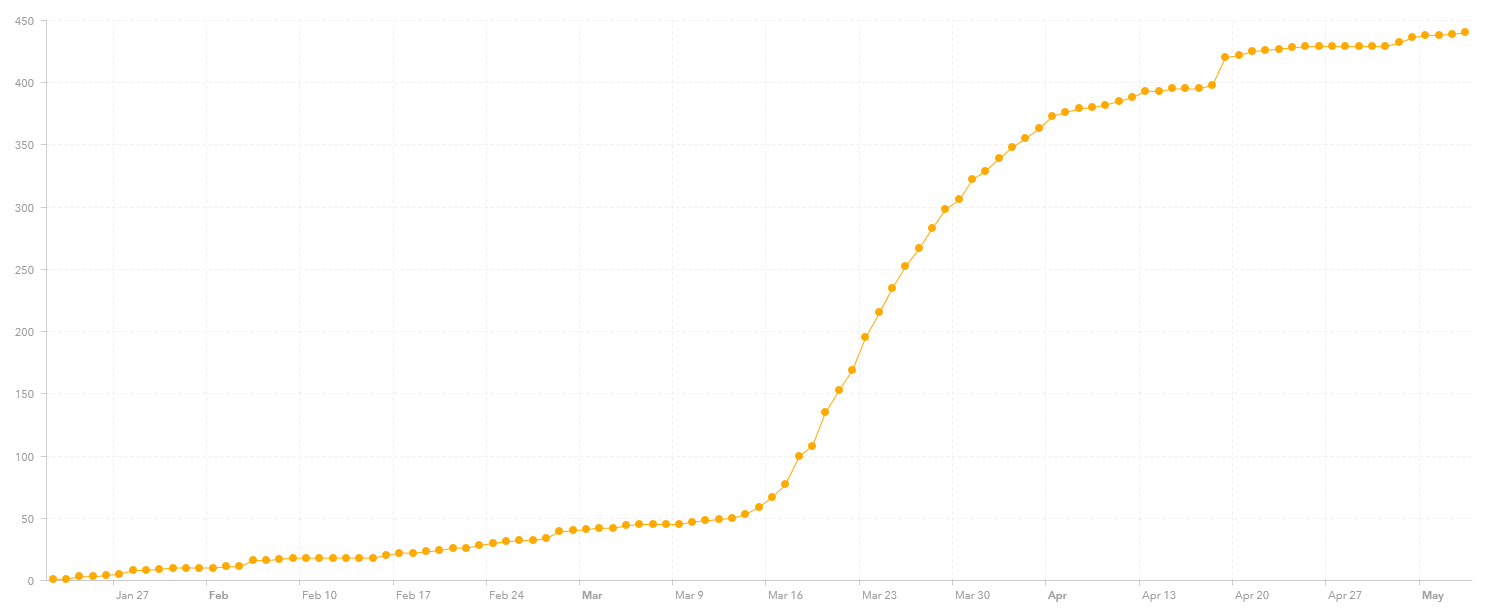
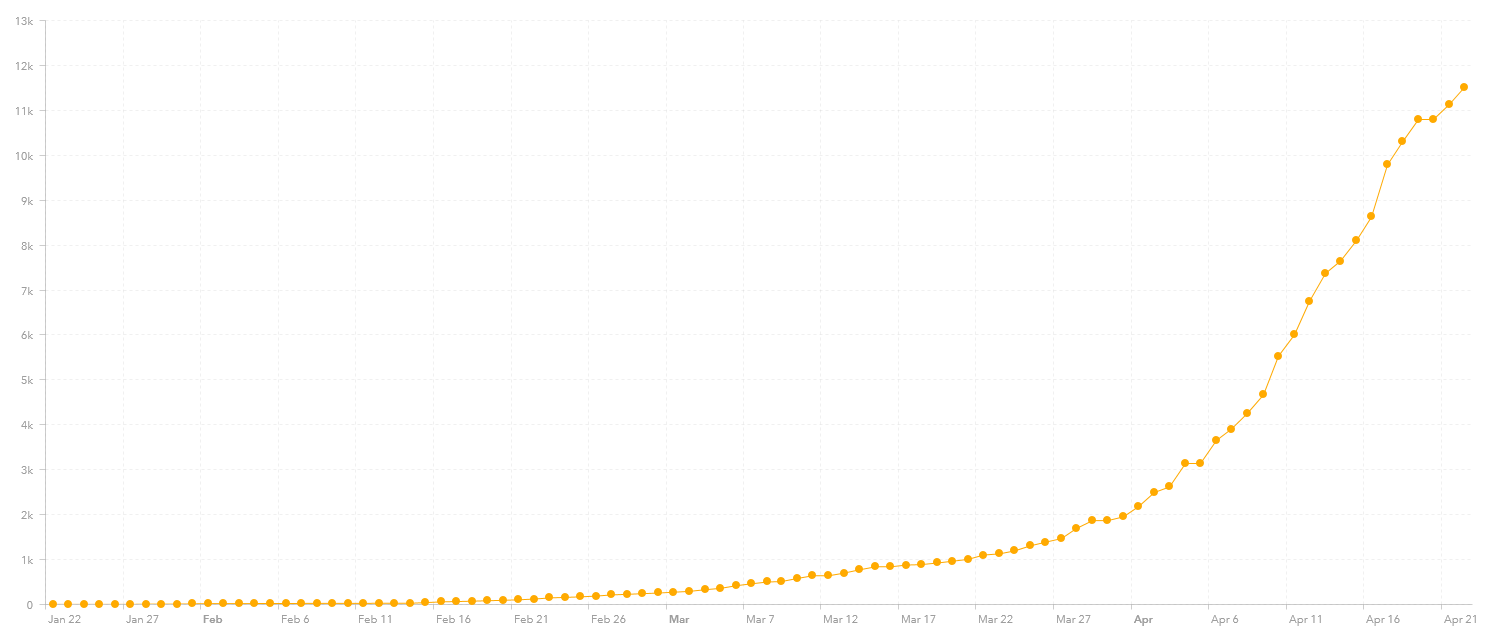
The Mortality Rate for the area is 4.06%, which is high. It either means lots of vulnerable people, or the number of cases of infection are being significantly underreported. The population known to be infected is 0.89%. or one confirmed case for every 112 people. It may be that over 2% of the area has been infected.
Last week the governor of Virginia (who is actually a medical doctor) extended the shut-down in Northern Virginia until 29 May. Certainly still needed and suspect he will need to extend it further. He gave a list of locales that were under that order, and it included every place mentioned above except Fredericksburg.
The Washington DC statistic area according to some also includes Warren, Clarke, Fauquier, and Spotsylvania Counties in Virginia, Jefferson County in West Virginia, Frederick, Howard, Charles and Calvert Counties in Maryland. I rarely go to these places and they were not listed in the Governor of Virginia’s order extending the lock-down in Northern Virginia. Of interest to me is Albemarle County, VA with 142 confirmed cases (124 last week) and 4 deaths, and Charlottesville, VA which has 72 confirmed cases (68 last week) and 2 deaths. Montgomery County, VA is unchanged with 66 cases this week (66 last week) and 1 death. Of course, who know what will happen if you bring in tens of thousands of students in the fall. These two areas are the home of UVA and Virginia Tech, two large universities located in a more rural environment.