Category Conventional warfare

The Meaning of Military Expenditures II

In response to my last blog post I basically threw out a menu of possible conclusions. I received a very nicely thought out response to that post from Mike Johnson, which I felt was deserving its own blog post. His response is below (with his permission, of course):

With regard to the 20 April 2016 blog entry about military expenditures, I appreciated the list of possible conclusions and thought I would throw discussion points.

The comparison between US and other country defense spending is interesting, including the often mentioned statement that the US spends as much on defense as the next 10 countries combined.  I remember, from when I was in OPNAV N80 a couple of decades ago, that our NATO allies had twice as many active duty personnel and twice as many reservists as all the US Services combined. Yet, their combined defense budgets were less than what we were spending on our people in our military personnel and reserve personnel appropriations. Of course, back then Germany and France and many others still had conscription and less is usually spent on conscripts. But, it still leads to some serious questions about how to compare defense budgets when our allies could have twice the personnel and their total budgets were less than what we spent just on our personnel.  Several factors come into play. First, we have retirees being paid starting around age 40 or even earlier.  I don’t know of any other country that pays retirees before the mid-50s if not the 60s. Second, the retirement and a lot of the heath care are paid by other departments in most other governments, but in the US DoD pays into these programs.  Base pay for British military, by comparable grade, is actually more than in the US military; but we then add BAH and BAS on top (tax free); in the UK, the MOD subsidizes housing, but the serviceman has to pay a part. It isn’t clear whether the UK or the US serviceman of comparable grade has more “take home pay” so I don’t think the difference is that we pay our servicemen significantly more than other countries.

When it comes to Russia and China, in particular, conversions using market rates understate what is spent for most of the defense spending.  I had a colleague over the years–an expert on the Soviets–who would argue that Russian Federation soldiers had to be underfed, and suffering from malnutrition, because of the amount they were paid and given for meals.  I pointed out that meals certainly should use PPP and not market rates to convert and at the time the ratio between the two was about 7 (PPP converted into about 7 times as many US dollars compared with what market rates; it is less dramatic today but still to be of consideration). Anything internal to the Russian or Chinese economies should, in my opinion, use PPP for the exchange (which compares the cost of comparable items in each system).  This is particularly true of personnel pay, messing, accommodations, and most of logistics.  I am not sure about weapon systems. These are paid for internally, but they do have a connection to the outside world.

The way we count is different.  For example, funding is appropriated to the Services and to agencies in OSD as a top line that can be obligated.  How that is paid for may come from many sources including revenue collected by the Service.  In European budgets, we routinely see factors like total resource and then they subtract from that number expected receipts amounting to several percent of the budget.  In other words, they spend more because they can spend their revenues (such as payments made by service members for their housing) for whatever they want, but they are deducted from the top line used for comparison.

The US military does spend a lot more than any other country, despite the above factors.  Part of that is what it takes to maintain 6 regional combatant commands. Part of it is maintaining a constant level of forces around the world.  A war with most of our enemies is much more likely to be in their front yard and not ours.  We spend a lot on R&D and a lot on keeping equipment modern. And we spend a lot on training personnel.

PPP is purchasing power parity, which is a comparison between the currencies of two countries at which each currency when exchanged for the other will purchase the same quantity of goods as it purchases at home. So, for example, when the ruble dropped from 30 to 60 to a dollar, the Soviet defense budget suddenly did not really drop in half. So a direct comparison of exchange rates between countries often de-values the defense expenditures of less developed countries, where good and services are relatively cheap. Comparing countries based upon PPP tries to adjust for that.

The Meaning of Military Expenditures

My last post was a data dump without a conclusion. I probably need to add one, although I usually avoid providing opinions. There is no shortage of opinions in the American blogosphere and political landscape. I think a little less opinion and a little more data has value. If you want opinions, there are plenty of services out there who specialize in that, and from any perspective and viewpoint that you like.

From the previous Military Expenditures posting one could draw a number of conclusions:

  1. That the American allies in NATO and Asia are not carrying their weight…or…
  2. The threat from Russia and China is grossly overstated
    1. Russia’s defense expenditures are $51.6 billion while NATO (not including the U.S.) is around $300 billion.
    2. China’s defense expenditures are $145.8 billion (or is it $215 billion) while Japan, South Korea and Taiwan’s combined are $85 billion.
    3. The U.S. is spending $597.5 billion.
    4. …or….
  3. The U.S. is spending too much on defense.
    1. Beware of the “military-industrial complex?”
    2. …or….
  4. This is the cost of being the world leader (3.3% of GDP on defense)….or…
  5. The higher U.S. defense expenditures are certainly justified because:
    1. We are covering against Russia ($51.6 billion)
    2. We are covering against China ($145.8 billion)
    3. Then there is ISIL….and….
    4. Iraq, Afghanistan and Somalia
    5. We have other missions, like nuclear deterrence, that adds to our cost.
    6. We need to continue to develop and maintain our technological edge, and that costs money.
    7. …or….
  6. The U.S. is spending too much on the wrong things…or….
  7. Maybe defense budget is not really a good measurement of military power….or…
  8. Maybe Russia and China are getting more “bang for the buck” then the U.S. and its western allies….or…
  9. Whatever else I forgot to mention….or….
  10. Some or all of the above.

Anyhow, one could interpret the figures in my previous post a number of different ways depending on their own political leanings and biases.

And…..I still didn’t really add a conclusion.

Military Expenditures

The American political campaign has ended up discussing NATO recently, including one candidate who states that NATO is “obsolete.” The sense is that America’s allies are not pulling their weight. Let us just look at some comparative defense budgets for a moment. Most figures below are estimates for 2015 from the International Institute of Strategic Studies (IISS), a private UK based organization. I cannot vouch for their accuracy, but they have been doing this for a while.

United States: $597.5 Billion or 3.3% of GDP

Now, our NATO allies are spending much less. The big spender is the United Kingdom at 56.2 billion or 2% of their GDP. This is followed by Germany at 36.6 billion which is only 1.1% of their rather large GDP (largest economy in Europe). France is at 32.0 billion or 1.9% of their GDP (note that the SIPRI figures are much higher for France). Other large NATO countries include:

Turkey…..….22.6….2.2% (these are 2014 SIPRI figures)

Italy….…..….21.1….1.1%

Canada………14.0…..0.9%

Spain…………10.7…..0.9%

Poland…..…..10.3….2.1%

Netherlands…10.1.…1.2% (these are 2014 SIPRI figures)

Total NATO expenditures (not including United States) for 2014 was $310 billion (SIPRI figures). I gather it is now somewhat less. It was the goal once that every member of NATO spent 2% of their GDP on national defense. Many NATO members are far below that goal.

So, it would appear that the U.S. spending 3.3% of its GDP on defense, while no major country in NATO is spending much more than 2% of its GDP on defense. In contrast Russia is spending $51.6 billion or 4.1% of GDP. So certainly between England, Germany, France, Italy, Turkey, Spain, Poland and the Netherlands they are spending at least $195.2 billon on defense, which is almost four times what Russia is spending.

If one looks to the Pacific, one sees the same pattern. The United States spends 597.5 billion on defense or 3.3%. Our ally Japan spends 41.4 billion or 1.0% of GDP. South Korea, sitting opposite the very unstable and dangerous North Korea, spends 33.4 million on defense or 2.4% of GDP. Taiwan, still claimed as a province by China, spends 10.2 billion or 1.9% of GDP.

In contrast China is spending 145.8 billion on defense or 1.2% of its GDP.


Now these are mostly IISS figures, there are somewhat different figures provided by the Stockholm International Peace Research Institute (SIPRI). For example they have the U.S. budget figures at 596.0 (vice 597.5) but this makes up 3.9% of GDP (vice 3.3%). Not sure why there is such a big difference in the figures for percent of GDP. They have a much higher figure for China (215 billion at 1.9% of GDP), Russia (66.4 billion at 5.4% of GDP) and France (50.9 billion at 2.1% of GDP). They have a world total figure of 1,676 billion (of which the United States spending makes up 35.6%) while the IISS has a world total figure of 1,563 billion (of which the United States spending makes up 38.2%).

Of course, this does not address how much “bang for the buck” people are getting.

Will This Weapon Change Infantry Warfare Forever? Maybe, But Probably Not

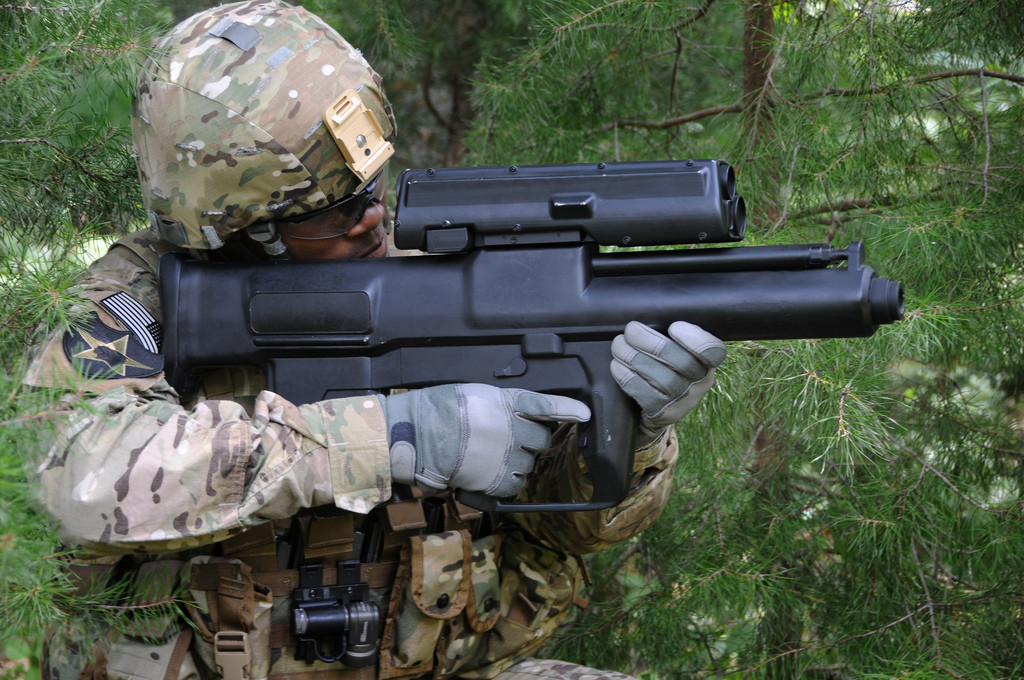
XM25 Counter Defilade Target Engagement (CDTE) System

The weapon pictured above is the XM25 Counter Defilade Target Engagement (CDTE) precision-guided grenade launcher. According to its manufacturer, Orbital ATK,

The XM25 is a next-generation, semi-automatic weapon designed for effectiveness against enemies protected by walls, dug into foxholes or hidden in hard-to-reach places.

The XM25 provides the soldier with a 300 percent to 500 percent increase in hit probability to defeat point, area and defilade targets out to 500 meters. The weapon features revolutionary high-explosive, airburst ammunition programmed by the weapon’s target acquisition/fire control system.

Following field testing in Afghanistan that reportedly produced mixed results, the U.S. Army is seeking funding the Fiscal Year 2017 defense budget to acquire 105 of the weapons for issue to specifically-trained personnel at the tactical unit level.

The purported capabilities of the weapon have certainly raised expectations for its utility. A program manager in the Army’s Program Executive Office declared “The introduction of the XM25 is akin to other revolutionary systems such as the machine gun, the airplane and the tank, all of which changed battlefield tactics.” An industry observer concurred, claiming that “The weapon’s potential revolutionary impact on infantry tactics is undeniable.”

Well…maybe. There is little doubt that the availability of precision-guided standoff weapons at the squad or platoon level will afford significant tactical advantages. Whatever technical problems that currently exist will be addressed and there will surely be improvements and upgrades.

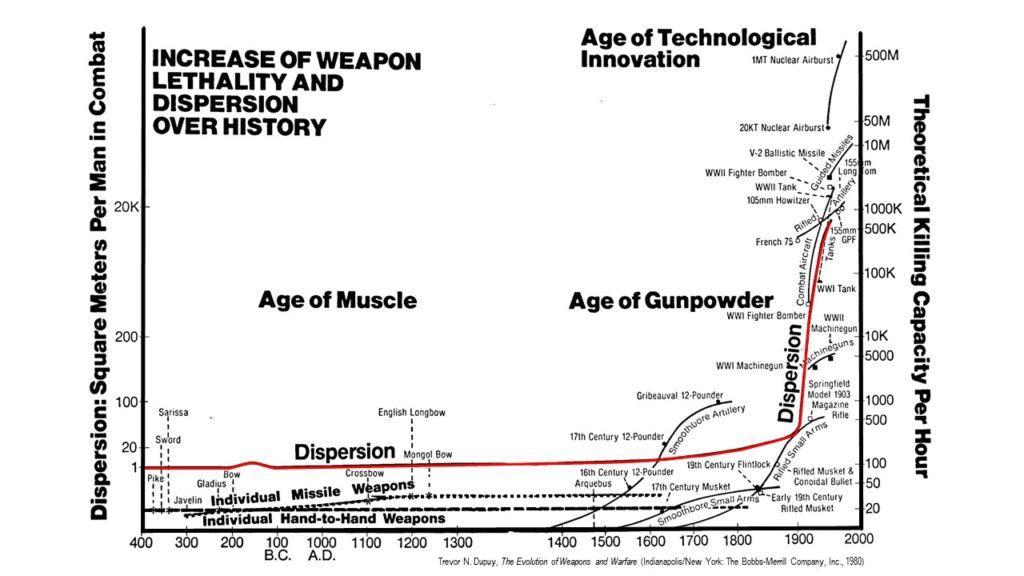
It seems unlikely, however, that the XM25 will bring revolutionary change to the battlefield. In his 1980 study The Evolution of Weapons and Warfare, Trevor N. Dupuy explored the ongoing historical relationship between technological change and adaptation on the battlefield. The introduction of increasingly lethal weapons has led to corresponding changes in the ways armies fight.

Assimilation of a significant increase in [weapon] lethality has generally been marked (a) by dispersion, thus reducing the number of people exposed to the new weapon in the enemy’s hands; (b) by giving greater freedom of maneuver; and (c) by improving cooperation among the different arms and services. [p. 337]

As the chart below illustrates (click for a larger version), as weapons have become more lethal over time, combat forces have adjusted by dispersing in greater frontage and depth on the battlefield (as reflected by the red line).

[pp. 288-289]

Dupuy noted that there is a lag between the introduction of a new weapon and its full integration into an army’s tactics and force structure.

In modern times — and to some extent in earlier eras — there has been an interval of approximately twenty years between introduction and assimilation of new weapons…it is significant that, despite the rising tempo of invention, this time lag remained relatively constant. [p. 338]

Moreover, Dupuy observed that true military revolutions are historically rare, and require more than technological change to occur.

Save for the recent significant exception of strategic nuclear weapons, there have been no historical instances in which new and more lethal weapons have, of themselves, altered the conduct of war or the balance of power until they have been incorporated into a new tactical system exploiting their lethality and permitting their coordination with other weapons. [p. 340]

Looking at the trends over time suggests that any resulting changes will be evolutionary rather than revolutionary. The ways armies historically have adapted to new weapons — dispersion, tactical flexibility, and combined arms —- are hallmarks of the fire and movement concept that is at the heart of modern combat tactics, which evolved in the early years of the 20th century, particularly during the First World War. However effective the XM25 may prove to be, it’s impact is unlikely to alter the basic elements of fire and movement tactics. Enemy combatants will likely adapt through even greater dispersion (the modern “empty battlefield“), tactical innovation, and combinations of countering weapons. It is also likely that it will take time, trial and error, and effective organizational leadership in order to take full advantage of the XM25’s capabilities.

[Edited]

Are They Channeling Trevor Dupuy?

TrevorCoverShot

Continuing the RAND description of their hex boardgame:

Ground unit combat strengths were based on a systematic scoring of individual weapons, from tanks and artillery down to light machine guns, which were then aggregated according to the tables of organization and equipment for the various classes of NATO and Russian units. Overall unit scores were adjusted to account for differences in training, sustainment, and other factors not otherwise captured. Air unit combat strengths were derived from the results of offline engagement, mission, and campaign-level modeling.

This looks like some kind of firepower or combat power score, or perhaps Trevor Dupuy’s OLIs (Operational Lethality Indexes). As they say “systematic scoring” one wonders what system they used. Know of only one scoring system that is systematic (meaning the OLIs, which are based upon formulae). The subject is probably best summarized in Dr. James Taylor’s article on “Consistent Scoring of Weapons and Aggregation of Forces:” http://www.dupuyinstitute.org/pdf/v2n2.pdf. This is the same James Taylor who wrote the definitive two-volume work on Lanchester equations.

I do note with interest the adjustment for “differences in training, sustainment, and other factors.” That is always good to see.

Also noted:

Full documentation of the gaming platform will be forthcoming in a subsequent report.

Look forward to reading it.

Lanchester equations have been weighed….

a-knights-tale_1

There have been a number of tests of Lanchester equations to historical data over the years. Versions of Lanchester equations were implemented in various ground combat models in the late 1960s and early 1970s without any rigorous testing. As John Stockfish of RAND stated in 1975 in his report: Models, Data, and War: A Critique of the Study of Conventional Forces:

However Lanchester is presently esteemed for his ‘combat model,’ and specifically his ‘N-square law’ of combat, which is nothing more than a mathematical formulation of the age-old military principal of force concentration. That there is no clear empirical verification of this law, or that Lanchester’s model or present versions of it may in fact be incapable of verification, have not detracted from this source of his luster.”

Since John Stockfish’s report in 1975 the tests of Lanchester have included:

(1) Janice B. Fain, “The Lanchester Equations and Historical Warfare: An Analysis of Sixty World War II Land Engagements.” Combat Data Subscription Service (HERO, Arlington, VA, Spring 1977);

(2) D. S. Hartley and R. L. Helmbold, “Validating Lanchester’s Square Law and Other Attrition Models,” in Warfare Modeling, J. Bracken, M. Kress, and R. E. Rosenthal, ed., (New York: John Wiley & Sons, 1995) and originally published in 1993;

(3) Jerome Bracken, “Lanchester Models of the Ardennes Campaign in Warfare Modeling (John Wiley & sons, Danvers, MA, 1995);

(4) R. D. Fricker, “Attrition Models of the Ardennes Campaign,” Naval Research Logistics, vol. 45, no. 1, January 1997;

(5) S. C. Clemens, “The Application of Lanchester Models to the Battle of Kursk” (unpublished manuscript, May 1997);

(6) 1LT Turker Turkes, Turkish Army, “Fitting Lanchester and Other Equations to the Battle of Kursk Data,” Dissertation for MS in Operations Research, March 2000;

(7) Captain John Dinges, U.S. Army, “Exploring the Validation of Lanchester Equations for the Battle of Kursk,” MS in Operations Research, June 2001;

(8) Tom Lucas and Turker Turkes, “Fitting Lanchester Equations to the Battles of Kursk and Ardennes,” Naval Research Logistics, 51, February 2004, pp. 95-116;

(9) Thomas W. Lucas and John A. Dinges, “The Effect of Battle Circumstances on Fitting Lanchester Equations to the Battle of Kursk,” forthcoming in Military Operations Research.

In all cases, it was from different data sets developed by us, with eight of the tests conducted completely independently of us and without our knowledge.

In all cases, they could not establish a Lanchester square law and really could not establish the Lanchester linear law. That is nine separate and independent tests in a row with basically no result. Furthermore, there has never been a test to historical data (meaning real-world combat data) that establishes Lanchester does apply to ground combat. This is added to the fact that Lanchester himself did not think it should. It does not get any clearer than that.

As Morse & Kimball stated in 1951 in Methods of Operations Research

Occasionally, however, it is useful to insert these constants into differential equations, to see what would happen in the long run if conditions were to remain the same, as far as the constants go. These differential equations, in order to be soluble, will have to represent extremely simplified forms of warfare; and therefore their range of applicability will be small.

And later they state:

Indeed an important problem in operations research for any type of warfare is the investigation, both theoretical and statistical, as to how nearly Lanchester’s laws apply.

I think this has now been done for land warfare, at last. Therefore, I conclude: Lanchester equations have been weighed, they have been measured, and they have been found wanting.

Really…..Lanchester?

RAND described the combat system from their hex boardgame as such:

The general game design was similar to that of traditional board wargames, with a hex grid governing movement superimposed on a map. Tactical Pilotage Charts (1:500,000 scale) were used, overlaid with 10-km hexes, as seen in Figure A.1. Land forces were represented at the battalion level and air units as squadrons; movement and combat were governed and adjudicated using rules and combat-result tables that incorporated both traditional gaming principles (e.g., Lanchester exchange rates) and the results of offline modeling….”

Now this catches my attention. Switching from a “series of tubes” to a hexagon boardgame brings back memories, but it is understandable. On the other hand, it is pretty widely known that no one has been able to make Lanchester equations work when tested to historical ground combat. There have been multiple efforts conducted to test this, mostly using the Ardennes and Kursk databases that we developed. In particular, Jerome Braken published his results in Modeling Warfare and Dr. Thomas Lucas out at Naval Post-Graduate School has conducted multiple tests to try to do the same thing. They all point to the same conclusion, which is that Lanchester equations do not really work for ground combat. They might work for air, but it is hard to tell from the RAND write-up whether they restricted the use of “Lanchester exchange rates” to only air combat. I could make the point by referencing many of these studies but this would be a long post. The issue is briefly discussed in Chapter Eighteen of my upcoming book War by Numbers and is discussed in depth in the TDI report “Casualty Estimation Methodologies Study.” Instead I will leave it to Frederick Lanchester himself, writing in 1914, to summarize the problem:

We have already seen that the N-square law applies broadly, if imperfectly, to military operations. On land, however, there sometimes exist special conditions and a multitude of factors extraneous to the hypothesis, whereby its operations may be suspended or masked.


Series of Tubes

clip_image002

RAND has published a report on its analysis of “NATO’s Eastern Flank” (meaning the three Baltic states). The PDF can be obtained here: http://www.rand.org/pubs/research_reports/RR1253.html  Of particular interest to us is Appendix A: Methodology and Data (page 12).

RAND is using a hex board game with counters that appears to have strength and movement factors on them. This is Tactics II…Avalon Hill…..SPI. RAND does have their own combat model, JICM (Joint Integrated Contingency Model), so why are they using a hex board game? According to their article:

RAND developed this map-based tabletop exercise because existing models were ill-suited to represent the many unknowns and uncertainties surrounding a conventional military campaign in the Baltics, where low force-to-space ratios and relatively open terrain meant that maneuver between dispersed forces—rather than pushing and shoving between opposing units arrayed along a linear front—would likely be the dominant mode of combat.

The problem is that JICM does movement down to having a series of “places” that are connected by “links.“ These links are tubes of variable width, connecting between each “place”. So for example, there might be a tube between St. Petersburg and Talinin. All combat would occur up and down this tube, but there could be no real movement out of the tube. This is a limited and somewhat inflexible movement system that has been used in a few other models (SOTACA comes to mind).

Now, I gather RAND has the whole map of the world set up for JICM as a “series of tubes.” According a 1995 report, there were nearly 1000 “places” and 2000 “links” for the entire world. This does not give a lot of fidelity, as the map of Korea shows at the top of the post. I suspect the fidelity is such that there are few tubes in an area as small as Estonia.

Estonia is small. It is 17,505 square miles. This is smaller than West Virginia (24,038 sq. miles), and it is a lot flatter. But, somehow, they have managed to maintain an independent language of over a million speakers (1.2 million actually). This language has managed to survive for over a thousand years! I am always impressed by that. Their capital is only about 100 miles from several points along the Russian border. This is about the distance between Washington DC and Richmond. Now granted, it took several years to cover that distance during the American Civil War, but there was a significant Confederate Army in the path. Therefore, to examine scenarios, I suspect they needed a map of considerably more fidelity than JICM and its “series of tubes.”

War by Numbers III

The table of contents for the book:

—             Preface                                                                                    6
One          Understanding War                                                                 8
Two          Force Ratios                                                                          15
Three       Attacker versus Defender                                                      22
Four         Human Factors                                                                      24
Five          Measuring Human Factors in Combat: Italy                          27
Six            Measuring Human Factors in Combat: Ardennes & Kursk   40
Seven       Measuring Human Factors in Combat: Modern Wars          55
Eight         Outcome of Battles                                                               67
Nine          Exchange Ratios                                                                  75
Ten           The Combat Value of Superior Situational Awareness        83
Eleven      The Combat Value of Surprise                                           113
Twelve      The Nature of Lower Level Combat                                   135
Thirteen    The Effects of Dispersion on Combat                                150
Fourteen   Advance Rates                                                                  164
Fifteen       Casualties                                                                         171
Sixteen      Urban Legends                                                                 197
Seventeen The Use of Case Studies                                                 248
Eighteen    Modeling Warfare                                                             270
Nineteen    Validation of the TNDM                                                    286
Twenty       Conclusions                                                                     313

Appendix I:   Dupuy’s Timeless Verities of Combat                           317
Appendix II:  Dupuy’s Combat Advance Rate Verities                       322
Appendix III: Dupuy’s Combat Attrition Verities                                 326

Bibliography                                                                                       331

Page numbers are based upon the manuscript and will certainly change. The book is 342 pages and 121,095 words. Definitely a lot shorter than the Kursk book.


War by Numbers II

What is it about (these two paragraphs are from my proposal):

War by Numbers looks at the basic nature of conventional warfare based upon extensive analysis of historical combat. Never passé, conventional combat capability has been a feature of the current growth of Islamic State in Iraq and the Levant (ISIL) and has returned as a threat in Eastern Europe. This book attempts to establish what we actually know about conventional combat and why we know it. It also provides an indication of how much impact various factors have on combat. It is the next step in analysis of combat that goes one step beyond what was addressed by theorists like Clausewitz.

It is the nature of the scientific process that hypothesis and theories do need to be tested and challenge. In a sense, we are attempting to add that rigor to a field that often does not operate with such rigor. In a profession where errors in judgment can result in the loss of lives, a rigorous understanding of warfare should be desired. War by Numbers attempts to provide such an understanding.