Page 10 for War by Numbers includes the following table:
European Theater of Operations (ETO) Data, 1944
Force Ratio Result Percent Failure Number of cases
0.55 to 1.01-to-1.00 Attack Fails 100% 5
1.15 to 1.88-to-1.00 Attack usually succeeds 21% 48
1.95 to 2.56-to-1.00 Attack usually succeeds 10% 21
2.71-to-1.00 and higher Attacker Advances 0% 42
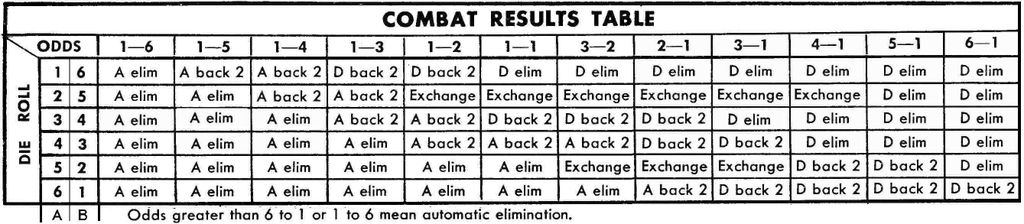
Many commercial wargames have something called a CRT or Combat Results Table. It is based upon force ratios. For example, this was one of the earliest CRTs used on Avalon Hill Games in the 1960s.
As can been seen from this Combat Results Table, at 1-to-1 the chances of an attack winning is one-in-three. At 2-to-1 odds the chances of the attacker winning is either the same as the defender winning or is a two-thirds chance of winning. At 3-to-1 odds, the attacker will always win.
Now the variable factor is the exchange result, which is defined that the defender removed everyone and the attacker removes as much as the defender. This usually results in an attacker win, if the attack has the right “spare change.” If the attacker was attacking with a single 7 strength unit against a 3 strength defender and they roll and exchange, then both units are eliminated.
Compare that to the table from my book based upon 116 division-level engagements from the European Theater of Operations (1944-145).
Needless to say, some elements of my book War by Numbers are of interest to the commercial wargaming community.
Poking around the internet, I ran across an article from 1985 by the British journalist and historian Max Hastings, rather provocatively titled “Their Wehrmacht was Better than our Army.” It was published in the Washington Post. I had not seen it before (as I went to work for Trevor Dupuy in 1987):
The language in the first couple of paragraphs is also pretty provocative.
The discussion then goes to Liddell Hart.
The discussion then goes to Trevor Dupuy and Martin Van Creveld.
From Dupuy: “On a man for man basis, German ground soldiers consistently inflicted casualties at about a 50 percent higher rate than they incurred from the opposing British and American troops under all circumstances. This was true when they were attacking and when they were defending, when they had a local numerical superiority and when they did not, when they won and when they lost.”
From Hastings: “A spirit of military narcissism, nourished by such films as “The Longest Day,” “A Bridge Too Far” and “The Battle of the Bulge,” was perpetuated mythical images of the Allied and German armies.”
From Hastings: “Yet to be a soldier in America has never been the honorable calling, outside a few thousand Army families. It has traditionally been the route by which young men of modest origins…may aspire to build a career.”
It is worthwhile to read the entire article.
Now, these claims were controversial in the 1980s, and a number of U.S. Army officers and people out at Leavenworth personally and professionally went after Trevor Dupuy over this issue. There was a long unpleasant discussion of that story written up by the lawyer Thomas Nutter. He was going to turn into a book, but I gather that effort was never completed.
I do address the subject of the relative performance of armies in combat in Chapters 4 through 7 of my book War by Numbers.
What we did was a simple comparison of the Soviet General Staff study data on the air fighting in the south compared to the daily records we gathered from the Second and Seventeenth Air Armies. What we found was their were minor differences in the sortie counts, but overall that was close to what was reported in the unit records we had.
On the other hand, the reports on casualties was not. There were outrageously incorrect estimations of enemy losses, which is typical of Soviet accounts. But as significant, the reports of their own losses were low. In particular, our count of Second Air Army losses from 5-18 July was 481, their count was 371. This Soviet General Staff study only reported 77% of their losses. Does this mean that if I draw losses reports from the Sixteenth Air Army from the Soviet General Staff study (as I don’t have the unit records), should I “inflate” them by 30%? (the inverse of 0.77).
Added to that, they simply left out the Seventeenth Air Army losses (182 aircraft). It may have been an oversight or a deliberate effort to downplay their losses.
But, just to focus on the Second Air Army losses, the staff study has the total losses for the 5th – 18th as 371: 172 fighters, 31 bombers, and 168 assault. We have the Second Air Army’s losses for 5 to 18 July 1943, taken from their daily reports, as 481 (See Table IV.32 of Kursk: The Battle of Prokhorovka). This includes 248 fighters, 48 bombers, 180 assault and 5 night bombers. So actual losses of the Second Air Army were 30% higher than what was reported in the Soviet General Staff study, or 28% if one leaves out the night bombers.
One does wonder about the process where even the internal classified post-operation staff studies understate their losses (in addition to many other errors). They did have the unit records available to them. In particular, their table is vastly off on the 5th of July when the Second Air Army lost 114 planes and the Soviet General Staff study reports only 78, but it consistently underreports for every single day. They also do not report the losses for the Seventeenth Air Army, which according to our count was another 182 or 221 planes lost (see Tables IV.34 and Tables IV.35). This does argue that the reported losses for the Sixteenth Air Army may be low compared to reality.
In the bigger picture, the Soviet General Staff studies are secondary sources, not primary sources. Furthermore they are secondary sources with considerable bias and errors. They invariably (grossly) overplay German losses and seemed to try to minimize their own losses. Furthermore their narrative of accounts often downplays certain aspects of their operations. They do have be used with extreme caution, as opposed to treating them as somewhat authoritative.
Now, Niklas Zetterling & Anders Frankson offer a similar discussion of the problems of relying on the Soviet General Staff studies in their book The Korsun Pocket: The Encirclement and Breakout of a German Army in the East, 1944. It is clear that these are secondary sources with biases that must be used with considerable caution.
This is the second part of my comparison of the data provided in the Soviet General Staff study on Kursk that was prepared in March-April 1944 compared to the Second and Seventeenth Air Army records that I have.
Losses:
There are one table on losses in the Soviet General Staff study on Kursk that relate to the Second and Seventeenth Air Army. They are provided below. I have broken it into two tables for this blog:
The Air Struggle Along the Enemy’s Main Axis
Air Enemy Losses:
Battles Fighter Bomber Total
5 July 81 71 83 154
6 July 64 40 65 105
7 July 74 44 78 122
8 July 65 54 52 106
9 July 62 49 22 71
10-14 July 152 112 93 205
15-18 July 43 45 27 72
Totals 541 415 420 835
Second Air Army Losses:
Fighter Bomber Assault Total
5 July 36 15 27 78
6 July 23 — 22 45
7 July 24 — 13 37
8 July 24 1 16 41
9 July 16 1 15 32
10-14 July 49 14 75 138
15-18 July (the figures in the line above cover from 10-18 July)
Totals 172 31 168 371
Now, these figures have been discussed before. The losses of the German VIII Air Corps was 111 planes, vice the 835 claimed here. The losses of the Second Air Army according to the records we reviewed was 481 planes from 5 to 18 July: see Appendix IV, Table II.32 (page 1424) of Kursk: The Battle of Prokhorovka), vice the 371 reported here. This report also does not include Seventeenth Air Army claims or losses. The Seventeenth Air Army’s losses were significant (182 planes). So, it does appear that the Soviet General Staff study basically leaves out 292 out of their 663 airplanes losses (44% of their losses), effectively under reporting their air losses by almost half.
This is concerning, for it does appear that Soviet General Staff study is understating the Second Air Army losses, omitting the considerable losses from the Seventeenth Air Army and of course, grossly overclaiming the number of German aircraft shot down. This was in an internal classified report that was supposed to be an analysis of the battle. Hard to properly analyze if your data is not correct.
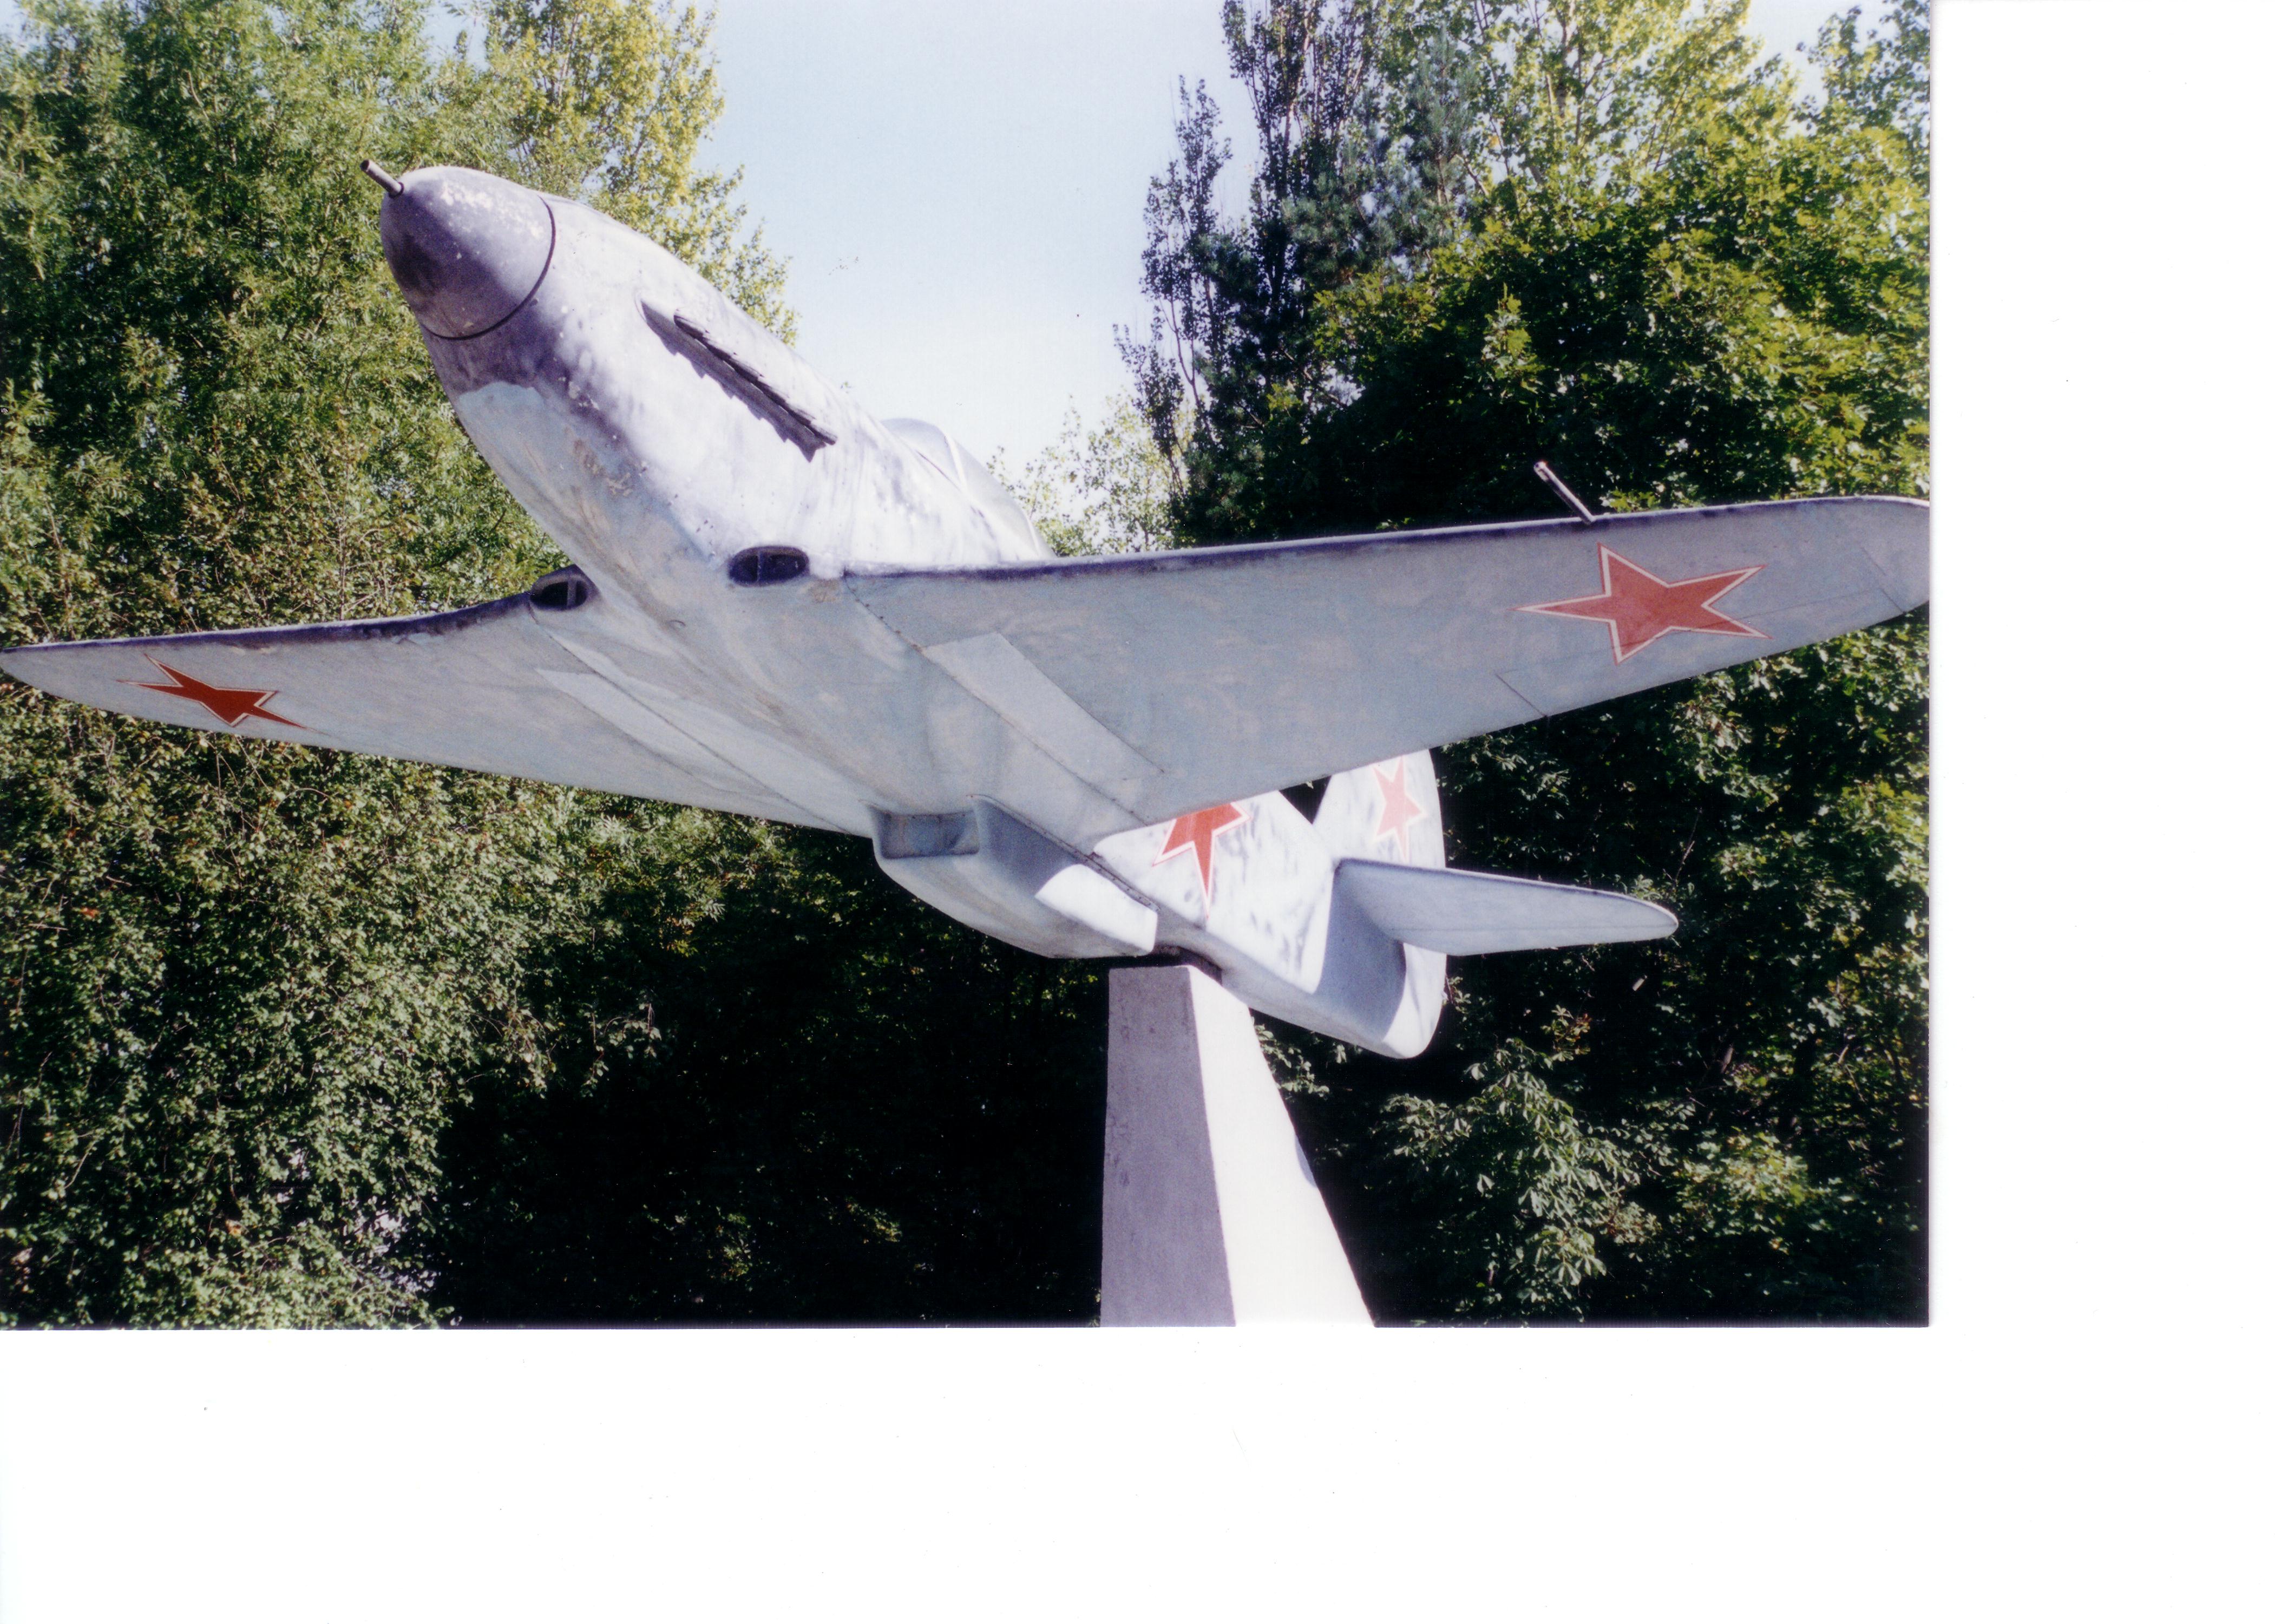
Yak-9 at war memorial, northeast of Yakovlevo, Belrorod-Oboyan road
For my on-going Aces at Kursk book I was asked by the publishers to include a Chapter on the air war in the north from 5-11 July 1943. For the original Kursk project we were able to access the Second and Seventeenth Air Army records in the south. We did not attempt to obtain the Sixteenth Air Army records at that time (1993-1995). Therefore I was forced to rely on the Soviet General Staff study on Kursk that was prepared in March-April 1944 for the count of sorties and losses. As the staff study also reported the sorties and losses from the south, and I had the records for the air armies involved in that, I decided to do a little comparison and added a write-up of this to an appendix of the book.
Sortie Counts (I left out the table of the sortie count from Soviet General Staff study) :
The Soviet General Staff study data on sortie counts is similar to the data we have assembled. The data we have for the Second and Seventeenth Air Armies operations are taken directly from the daily air army reports as drawn from the archives. The Soviet General Staff study may used these same reports, or used higher level reports or other assembled reports for their study. But there are minor differences between ours and their reports, so most likely they used other higher level or assembled reports for their study. For example, we have the Second Air Army flying 1,296 daytime sorties on 5 July. The Soviet General Staff study has them flying 1,274. There are also minor differences the next two days, but the two sets of counts are the same for 8 and 9 July and then vary slightly for most of the subsequent days (except for the 15th and 16th, where they again match). After the 5th, the largest difference is on the 12th, where our reports record 10 more daytime sorties. These are very minor differences. The Second Air Army nighttime sorties match in all cases between the counts we assembled from the air army daily reports and what the Soviet General Staff study reports.
The Seventeenth Air Army is a little more complex as some of their missions were flown into the battle area while other of their missions were flown completely out of the battle area defended by the Voronezh Front. For the Kursk database project, I ended up reviewing each reported mission as to where it operated and made a judgment as to whether this mission was in the area of the Belgorod offensive or not. It does not appear that the Soviet General Staff study did that. For the 5th through the 16th, their estimate more closely matches with the total number of sorties flown by the Seventeenth Air Army than it does with my lower count of the number of sorties flown in the battle area. On eight of those 12 days in question, their totals matches the total we drew from the Seventeenth Air Army daily reports. The day they most differ was on 7 July when they reported 50 more sorties than we counted. We did re-check the original report and our total is 639. Suspect their number of 689 is a typo. As the Soviet General Staff study may have been drawn from a later aggregate report, there are multiple opportunities for typos.
On the other hand, in the table we assembled of Seventeenth Air Army daytime sorties we had a lower count for “only those that were in the Belgorod Area or attacked the VIII Air Corps” (see table in Chapter Four). It is consistently lower from the 5th through the 16th, which the worse variance being on the 7th, where we count 588 as valid sorties in the battle area, whereas the Soviet General Staff study reports 689. On the 17th we count none in the area and on the 18th we count 12 sorties.
Still there are a couple of observations we can make from this comparison. First, is that the Soviet General Staff study reports of Soviet sorties flown is fairly accurate in that it matches with records we have from the Second and Seventeenth Air Armies. This is important to note as we rely on the Soviet General Staff study for the count of sorties for the Sixteenth Air Army.
The Dupuy Institute does occasionally make use of a combat model developed by Trevor Dupuy called the Tactical Numerical Deterministic Model (TNDM). That model is a development of his older model the Quantified Judgment Model (QJM).
There is an impression, because the QJM is widely known, that the TNDM is heavily involved in our work. In fact, over 90% of our work has not involved the TNDM. Here a list of major projects/publications that we done since 1993.
Based upon TNDM:
Artillery Suppression Study – study never completed (1993-1995)
Air Model Historical Data feasibility study (1995)
Support contract for South African TNDM (1996?)
International TNDM Newsletter (1996-1998, 2009-2010)
TNDM sale to Finland (2002?)
FCS Study – 2 studies (2006)
TNDM sale to Singapore (2009)
Small-Unit Engagement Database (2011)
Addressed the TNDM:
Bosnia Casualty Estimate (1995) – used the TNDM to evaluate one possible scenario
Casualty Estimation Methodologies Study (2005) – was two of the six methodologies tested
Data for Wargames training course (2016)
War by Numbers (2017) – addressed in two chapters out of 20
Did not use the TNDM:
Kursk Data Base (1993-1996)
Landmine Study for JCS (1996)
Combat Mortality Study (1998)
Record Keeping Survey (1998-2000)
Capture Rate Studies – 3 studies (1998-2001)
Other Landmine Studies – 6 studies (2000-2001)
Lighter Weight Armor Study (2001)
Urban Warfare – 3 studies (2002-2004)
Base Realignment studies for PA – 3 studies (2003-2005)
Chinese Doctrine Study (2003)
Situational Awareness Study (2004)
Iraq Casualty Estimate (2004-2005)
The use of chemical warfare in WWI – feasibility study (2005?)
Battle of Britain Data Base (2005)
1969 Sino-Soviet Conflict (2006)
MISS – Modern Insurgency Spread Sheets (2006-2009)
Our bread and butter was all the studies that “did not use the TNDM.” Basically the capture rate studies, the urban warfare studies and the insurgencies studies kept us steadily funded for year after year. We would have not been able to maintain TDI on the TNDM. We had one contract in excess of $100K in 1994-95 (the Artillery Suppression study) and our next TNDM related contract that was over $100K was in 2005.
Now, this was one of the many asides that I developed during the writing of the book and I felt one of the more significant discussions in the book. I am always concerned that a number of major points in that book were drowned in the 1,662 pages. I am glad he was able to identify and pull that one out.
The quote is in his blog post, but for the battle we estimated that the Germans fired 51,083 tons of ammunition while the Soviets fired 21,867 tons. I don’t think anyone else have made such a calculation.
For the Soviet rocket launchers (Katyushas) they fired an estimated 2,422 tons of ammo, while for the German rocket launchers (Nebelwerfers) they fired 5,916 tons of ammo.
This is subject that probably could be the basis of a complete stand-alone study or book. I suspect if this was the case at Kursk, where the Soviet army had three months to prepare and stockpile, then it is very much an issue for other, especially more mobile, operations.
P.S. The complete quote is also in this earlier blog post:
Col. General Wolfram Baron von Richthofen, 1942 (Bundesarchive Bild 101I-452-0985-36)
While there are 783 blog posts that I have made to the Mystics and Statistics blog, I do have seven other articles written on other sites, all in 2015 and 2016.
While I was writing this blog post a week ago, I noticed a message from nine months ago on the History New Network to this last article. It was from Dr. Andrew Arthy of Australia. Turns out he has a copy of the Wolfram von Richthofen’s notes from a discussion he had with Generaloberst Jeschonnek on 25 May 1943. So finally got confirmation that this was indeed a valid quote from David Iriving.
As a result of a comment by Tom from Cornwall, we ended up adding three posts to this discussion that looked at terrain and amphibious operations and river crossings in Italy:
The previous posts on this discussion on force ratios are presented here. These were the posts examining the erroneous interpretation of the three-to-one rule as presented in Army FM 6-0 and other publications:
We are going to end this discussion for now. There is some additional data from the European Theater of Operations (ETO) and Ardennes that we have assembled, but it presents a confusing picture. This is discussed in depth in War by Numbers (pages 32-48).
I am assembling these discussions on force ratios and terrain into the opening chapters for a follow-on book to War by Numbers.
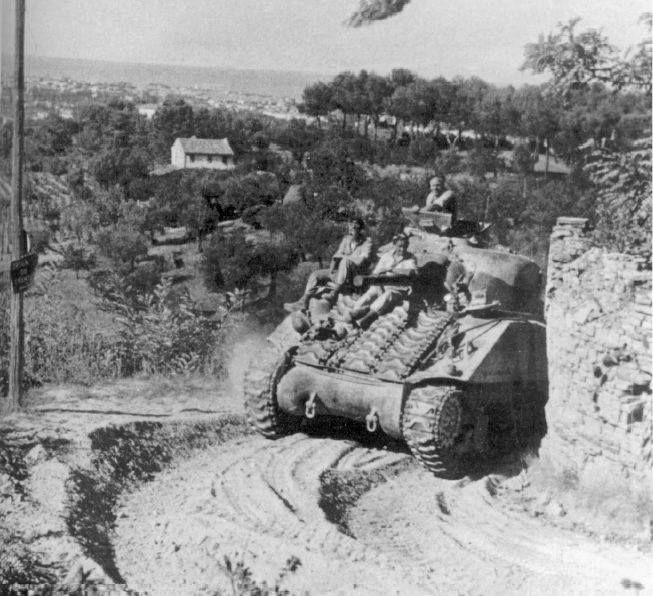
Polish Sherman III after battle on Gothic Line, Italy, September 1944
Having looked at casualty exchanges from my book War by Numbers and in the previous post, it is clear that there are notable differences between the German and Soviet armies, and between the Israeli and Arab armies. These differences show up in the force ratio tables, in the percent of wins, and in the casualty exchange ratios. As shown above, there is also a difference between the German and the U.S. and UK armies in Italy 1943-44, but this difference is no where to the same degree. These differences show up in the casualty exchange ratios. They also will show up in the force ratio comparisons that follow.
The Italian Campaign is an untapped goldmine for research into human factors. In addition to German, American and British armies, there were Brazilian, Canadian, French, French Algerian, French Moroccan, Greek, Indian, Italian, New Zealander, Polish, and South African forces there, among others like the Jewish brigade. There was also an African-American Division and a Japanese-American battalion and regiment actively engaged in this theater. Also the German records are much better than they were in the second half of 1944. So, the primary source data these engagements are built from are better than the engagements from the ETO.
We have 137 engagements from the Italian Campaign. There are 136 from 9 September to 4 June 1944 and one from13-17 September 1944. Of those, 70 consisted of the Americans attacking, 49 consisted of armed forces of the United Kingdom in the offense, and 18 consisted of the Germans attacks, often limited and local counterattacks (eight attacks against the United States and ten attacks against the UK). So, let us compare these based upon force ratios.
American Army attacking the German Army, Italy 1943-44
(70 cases in the complete data set, 62 cases in the culled data set)
Force Ratio……………Percent Attacker Wins………………..Number of Cases
There were seven cases of engagements coded as “limited attacks” and one case of “other”. These eight cases are excluded in the table above on those lines in italics.
Needless to say, this is a fairly good performance by the American Army, with them winning more than 40% the attacks below two-to-one and pretty winning most of them (86%) at odds above two-to-one.
British Army attacking the German Army, Italy 1943-44
(49 cases in the complete data set, 39 cases in the culled data set)
Force Ratio………………..Percent Attacker Wins………………..Number of Cases
There were five cases of limited action and five cases of limited attack. These ten cases are excluded in the table above on those lines in italics.
This again shows the difference in performance between the American Army and the British Army. This is always an uncomfortable comparison, as this author is somewhat of an anglophile with a grandfather from Liverpool; but data is data. In this case they won 44% of the time at attacks below two-to-one, which is similar to what the U.S. Army did. But then, they only won only 63% of the time at odds above two-to-one (using the culled data set). This could just be statistical anomaly as we are only looking at 30 cases, but is does support the results we are seeing from the casualty data.
What is interesting is the mix of attacks. For the American Army 77% of the attacks were at odds below two-to-one, for the British Army only 23% of the attacks were at odds below two-to-one (using the culled data sets). While these 99 cases do not include every engagement in the Italian Campaign at that time, they include many of the major and significant ones. They are probably a good representation. This does probably reflect a little reality here, in that the British tended to be more conservative on the attack then the Americans. This is also demonstrated by the British lower average loss per engagement.[7]
The reverse, which is when the Germans are attacking, does not provide a clear picture.
German Army attacking the American and British Army, Italy 1943-44 – complete data set (18 cases)
Force Ratio…………………..Percent Attacker Wins…………………Number of Cases
0.72 to 0.84………………………….0%………………………………………………7
1.17 to 1.48………………………..50…………………………………………………6
1.89…………………………………….0…………………………………………………1
2.16 to 2.20………………………..50…………………………………………………2
Gap in data
3.12 to 3.24………………………..50…………………………………………………2
The Germans only win in 28% of the cases here. They win in 13% of the engagements versus the U.S. (8 cases) and 40% of the engagements the UK (10 cases). Still, at low odds attacks (1.17 to 1.48-to-1) they are winning 50% of the time. They are conducting 78% of their attacks at odds below two-to-one.
In the end, the analysis here is limited by the number of cases. It is hard to draw any definitive conclusions from only 18 cases of attacks. Clearly the analysis would benefit with a more exhaustive collection of engagements from the Italian Campaign. This would require a significant investment of time (and money).[8]
Regiment de Trois-Rivieres tanks entering the ruins of Regabuto, August 4th, 1943. Source: http://www.sfu.ca/tracesofthepast/wwii_html/it.htm
————————–
[1] There were four limited attacks that resulted in three defender wins and a draw. There was one “other” that was an attacker win.
[2] There three limited attacks that resulted in two defender wins and a draw.
[3] There were four “limited actions” that were defender wins and one “limited attack” that was a defender win.
[4] There as one “limited action” that was a defender win and two “limited attacks” that were defender wins.
[5] There were two “limited attacks” that were defender wins.
[6] The author’s grandfather was born in Liverpool and raised in Liverpool, England and Ryls, Wales. He served in the British merchant marine during World War I and afterwards was part of the British intervention at Murmansk Russia in 1918-1919. See the blog post:
[7] See War by Numbers, pages 25-27. The data shows that for the Americans in those 36 cases where their attack was successful they suffered an average of 353 casualties per engagement. For the 34 American attacks that were not successful they suffered an average of 351 casualties per engagement. For the UK, in the 23 cases where their attack was successful, the UK suffered an average of 213 casualties per engagement. Of the 26 cases where the UK attacks were not successful, they suffered an average of 137 casualties per engagement.
[8] Curt Johnson, the vice-president of HERO, estimated that it took an average of three man-days to create an engagement. He was involved in developing the original database that included about half of the 137 Italian Campaign engagements. My estimation parameter, including the primary source research required to conduct this is more like six days. Regardless, this would mean that just to create this 137 case database took an estimated 411 to 822 man-days, or 1.6 to 3.3 man-years of effort. Therefore, to expand this data set to a more useful number of engagements is going to take several years of effort.