The opening line states: “The RAND Corporation’s annual ‘Red on Blue’ wargame simulation found that the United States would be a loser in a conventional confrontation with Russia and China.”
A few other quotes:
“Blue gets its ass handed to it.”
“…the U.S. forces ‘suffer heavy losses in one scenario after another and still can’t stop Russia or China from overrunning U.S. allies in the Baltics or Taiwan:”
“The US and NATO are unable to stop an attack in the Balkans by the Russians,….
“…and the United States and its allies are unable to prevent the takeover of Taiwan by China.
The articles do not state what simulations were used to wargame this. The second article references this RAND study (RAND Report) but my quick perusal of it did not identify what simulations were used. A search on the words “model” and “wargame” produced nothing. The words “simulation” and “gaming” leads to the following:
“It draws on research, analysis, and gaming that the RAND Corporation has done in recent years, incorporating the efforts of strategists, regional specialists, experts in both conventional and irregular military operations, and those skilled in the use of combat simulation tools.”
“Money, time, and talent must therefore be allocated not only to the development and procurement of new equipment and infrastructure, but also to concept development, gaming and analysis, field experimentation, and exploratory joint force exercises.”
Anyhow, curious as to what wargames they were using (JICM – Joint Integrated Contingency Model?). I was not able to find out with a cursory search.
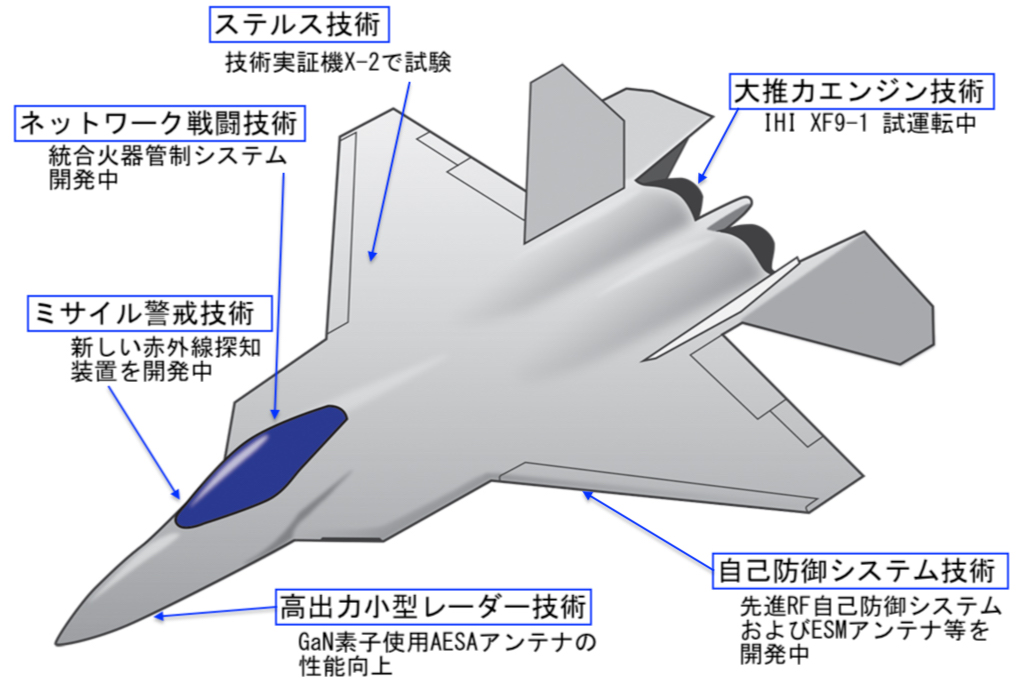
A schematic rendering of Japan’s proposed F-3 fighter [Tokyoexpress.info]
In my previous post, I discussed the progression of aircraft in use by the Japanese Air Self Defense Force (JASDF) since World War II. Japan has also invested significant sums in its domestic aerospace manufacturing capability over this same time period.
Japanese aircraft manufacturing has long been closely tied to the U.S Air Force (USAF) and U.S. aerospace majors offering aircraft for sales, as well as licensed production. Japanese aerospace trade groups categorize this into several distinct phases, including:
Restarting the aircraft business – starting in 1952 during the Korean War, Japanese aerospace firms like Mitsubishi and Kawasaki reacquired aircraft manufacturing capability by securing contacts with the USAF for maintenance, repair and overhaul (MRO) of damaged USAF aircraft, including the F-86 Sabre, considered by the Americans to be the star aircraft of the war (although many believe its opponent from the Soviet side, the MiG-15 to have been superior.) There was little doubt, then, that the JASDF would purchase the F-86 and then license its domestic production.
Licensed production of US military aircraft – “Japan has engaged in licensed production of U.S. state-of-the-art fighter planes, from the F-86 to the F-104, the F-4, and the F-15. Through these projects, the Japanese aircraft industry revived the technical capabilities necessary to domestically manufacture entire aircraft.”
Domestic military aircraft production – Japanese designed aircraft, while independent, unique designs, also leveraged certain Western designed aircraft as their inspiration, such as the T-1 and eventual F-1 follow-on and the clear resemblance to the British Jaguar. This pattern was repeated in 1987 with the F-2 and its clear design basis on the F-16.
Domestic Production of business, and civil aircraft – “Japan domestically produces the YS-11 passenger plane as well as the FA-200, MU-2, FA-300, MU-300, BK-117, and other commercial aircraft, and is an active participant in international joint development programs with partners such as the American passenger aircraft manufacturer Boeing.”
Mitsubishi Heavy Industries (MHI) won a contract to build the wing for the Boeing 787, a job that Boeing now considers a core competency, and is unlikely to outsource again (they kept this task in house for the more recent 737 MAX, and 777X aircraft). This shows MHI’s depth of capability.
Also in the previous post, I could not help but include the “F-22J,” a hypothetical fighter that has been requested by the Japanese government numerous times, as the air power threat from the Chinese People’s Liberation Army Air Force (PLAAF) has grown. The export of the F-22, however, was outlawed by the Obey amendment to the 1998 Defense Authorization Act (a useful summary of this debate is here). So stymied, the JASDF and supporting Ministry of Defense personnel conducted a series of design studies in order to establish detailed requirements. These studies clarified the approach to be taken for the next aircraft to put into service, the F-3 program, ostensibly a successor to the F-2, although the role to be played is more of an air superiority or air dominance fighter, rather than a strike fighter. These studies concluded that range, or endurance is the most important metric for survivability, a very interesting result indeed.
Airframe developers…appear to have settled on something close to the 2013 configuration for the F-3 that emphasized endurance and weapons load over flight performance… That design, 25DMU, described a heavy fighter with a belly weapons bay for six ramjet missiles about the size of the MBDA Meteor. The wing was large and slender by fighter standards, offering high fuel volume and low drag due to lift but penalizing acceleration.… The key factor was that the high-endurance design provided more aircraft on station than would be available from an alternative fleet of high-performance fighters. – (Aviation Week & Space Technology, February 15-28, 2016)
I am curious about the air combat models that reached the conclusion that endurance is the key metric for a new fighter. Similar USAF combat models indicated that in a conflict with PLA armed forces, the USAF would be pushed back to their bases in Japan after the first few days. “In any air war we do great in the first couple of days. Then we have to move everything back to Japan, and we can’t generate sufficient sorties from that point for deep strike on the mainland,” according to Christopher Johnson, former CIA senior China analyst [“The rivals,” The Economist, 20 October 2018]. (History reminds us of aircraft designed for range and maneuverability, the Mitsubishi A6M “Zero,” which also de-emphasized durability, such as pilot armor or self-sealing fuel tanks … was this the best choice?) Validation of combat models with historical combat data seems like an excellent choice if you are investing trillions of Yen, putting the lives of your military pilots on the line, and investing in a platform that will be in service for decades.
Given this expected cost, Japan faces a choice to develop the F-3 independently, or with foreign partners. Mitsubishi built and flew the X-2 “Shinshin” prototype in April 2016. The JASDF also issued an RFP to existing aircraft manufacturers, including the BAE Eurofighter Typhoon, the Boeing F-15 Eagle, and the Lockheed Martin F-22 Raptor. In October 2018, the Typhoon and the Eagle were rejected for not meeting the requirements, while the Raptor was rejected because “no clear explanation was given about the possibility of the U.S. government lifting the export ban.” The prospect of funding the entire cost of the F-3 fighter by independently developing the X-2 also does not appear acceptable, so Japan will look for a foreign partner for co-development. There is no shortage of options, from the British, the Franco-Germans, or multiple options with the Americans.
Right now (as of 2017) the U.S. GDP is $19.391 Trillion according to the World Bank. The Chinese economy is $12.238 Trillion. This is 63% of the U.S. economy. No economy has been that close to the U.S. economy since Japan leading up to 1995.
It is a rather amazing growth on the part of China. Back in the bad old days, after we had fought a war with them over Korea, they were threatening to invade Taiwan, they were supporting North Vietnam against our ally South Vietnam, and allied with the Soviet Union as part of the Communist Bloc, the difference was much greater. The U.S. GDP in 1960 was 543.3 Billion, while China’s was 59.716, meaning the U.S. economy was 9 times greater. Now it is only 1.6 times greater.
Of course, the two economies are intertwined, with the United States being China’s largest trading partner. This sort of leads to the odd situation where some in the U.S. and China consider the other to be a rival. But, I can’t think of too many cases where major trading partners were opposing hostile players on the world stage. Still, it is a very uncomfortable arrangement with the U.S. nominally the leader of the free world, while China had been known to run over its people with tanks. They are still very much a dictatorship. So the two nations seem to exist as trading partners who are not really friends and not really enemies. They may be rivals in the long run, or may not. There is, of course, an on-going trade dispute between the two nations.
Now….if were extend those lines on the graph out…..it does look like they will cross at some point around 2050 or so. This of course, leads me back to this post:
It is projected that by 2050 the Chinese population will decline to 1.36 billion by 2050 (it is currently 1.41 billion) while the U.S. will grow to 402 million by 2050 (it is currently 328 million). For a number of reasons, I don’t think we will see the Chinese economy exceed the U.S. economy by 2050.
India is still not thought of by many as a world power, but in the long run, as its economy and population grow, it will join this esteemed company. It is the 2nd largest population in the world and the 6th largest economy in the world. Its economy is about the size of its old colonial master, the United Kingdom. It is a nuclear power, although we gather it has not weaponized many nukes. Still, it is a poor country, with a per capita income of $1,983 per person (per year…IMF 2017 figures).
Unlike China, there was no draconian one-child policy adopted, so Indian population continued to grow at a rate that is about to catapult it past China as the most populous country in the world. This is expected to happen in 2024 or 2030, or whenever. Sometime in the next decade.
The population of India for 2017 is estimated at 1.324 million, or 1.3 billion. This puts the population of the world’s largest democracy around four times that of the United States. It is almost four times what its population was in 1951 (361 million). In the early 1950s China had a population around 60 percent larger than India. Now, they are almost equal, although China has considerable more wealth.
The rapid Chinese economic growth has lead to it having a GDP of $12 trillion compared to the more anemic GDP of India at only $2.6 trillion. Needless to say, there is also a big difference in per capita income.
But while China is growing at a rate of only .59% a year and its population is expected to fall, India is expected to continue growing. Its growth rate in 2016 was 1.19% and its fertility rates are 2.45 children per woman (2016 estimate from CIA World Factbook). The annual growth rate remains at over one percent a year. But, the growth rate of the population appears to be declining, like it is in most areas of the world, developed or developing. India does have some emigration and immigration, but the population is so massive that this does not have a huge impact on population growth rates. The demographic pyramid is actually much more pyramidal that the others we have seen, although it is clear towards that bottom of the pyramid that they are now controlling their population growth rates.
India is truly a multi-ethnic, multi-linguistic and multi-religious society. It has something like more than 2,000 ethnic groups. Forgive me if I don’t list them. About 40% of Indians speak Hindi (an Indo-European language) as their first language, and over half the population can speak it. Over 10% of the population speaks English, making it the second largest English speaking country in the world. Religious affiliation is a little more unified with Hindu’s making up almost 80% of the population. There are Muslims (14% or more), Christians (2.3%), Sikhs (1.7%), Buddists, Jainism and even practitioners of Zoroastrianism (look that one up in your Funk and Wagnells). Keep in mind that 14% of 1.3 billion makes this the third largest Muslim population in the world with over 170 million Muslims.
The Indian population is expected to grow for a while. The United Nations predicts the Indian population will be 1.7 billion in 2050. This compares to 402 million for the United States and 1.36 billion for China estimated in 2050.
India economic growth rate has been around 6% a year for the last two decades. Depending on continued economic growth, this is a country that will slowly and surely take its place among the nations of the world.
China is the most populous country/region in the world. In its unified and un-unified forms, it has been forever, so it seems. It certainly has been since the fall of the Roman Empire, although one can argue that the British Empire was larger for a moment. Oddly enough, the pre-eminent position that it has held for over 1,500 years, is about to be surpassed by India. China, in its wisdom brought it population under control decades ago, encouraging smaller families. This has allowed it to further develop and economically grow. Quite simply, if a country’s economic growth is 3% a year, and its population growth is 3% a year, then the average person is basically getting nowhere. This has been the case for many nations in the developing world. China has broken from that pattern.
The population of China (People’s Republic of China) for 2017 is estimated at 1,411 million, or 1.4 billion. This is a staggering figure making it almost five times (4.6 times) as many people as the United States. It is around three times what its population was in 1950. The population in its first official national census taken by the People’s Republic of China in 1953 was 583 million. It was a little hard to determine what the population of China was until the post-war period. Post-war in this case means post-Warlord period, post-Sino-Japanese War, post-World War II and post-Chinese Civil War. The Chinese population was almost four times larger than the United States in 1950/1953, back in the days when we were at war with China in the Korean peninsula. The Chinese population is now growing at a rate of 0.59% percent a year (a half percent a year). This is very low.
The fertility rates in China are 1.62 children per woman (2016) according to National Health and Family Planning Commission (NHFPC) and 1.29 in 2016 according to the National Bureau of Statistics (NBS). Not sure why there is such a difference. Regardless, this is not replacement rate and well below 2.1. It is a birth rate lower that what we see in many developed countries, although China is a still a developing country. This low birth rate was a result of the one-child policy instituted by the Communist Party in 1979. It appears to have not only worked, but it worked too well. In 2015, the government instituted a two-child policy. According to NHFPC, they are expecting the birth rate to grow to 1.8. I guess this is one of the goals of the 13th Five-Year Plan. This is still not replacement rate. China does have some emigration and immigration, but the population is so massive that this does not have a huge impact on population growth rates.
They have classified 91.51% of the population of China as Han Chinese. Still, 8.5% of 1.5 billion creates some significant minorities. This includes the Tibetians, with at least 2.8 million, and the Turkish Uyghurs estimated at 3.6 million. I ate recently at a Uyghur restaurant in Crystal City, VA. I have never seen to one of those before.
Most likely the Chinese population will experience negative population growth by 2030. The United Nations predicts the Chinese population will be 1.36 billion in 2050. This compares to 402 for the United States and 132 for Russian in 2050. Predicting population over 30 years is not that difficult. On the other hand, there is a projection that Chinese population will decline to 1.02 billion by 2100. I would not hang my hat on that last figure.
The population is aging, with its demographic “pyramid” developing a narrowing at the bottom. The demographic “pyramid” from 2015 is below:
These figures do not include Taiwan (Republic of China) or Macau (Macao Special Administrative Region). It does include the city of Hong Kong. Mainland China claims Taiwan is part of China and has had an army posed across the straights ready to invade for almost 70 years. I am guessing if they have not invaded in the last 70 years, they are not going to invade in the next 70, especially as Taiwan is a major trading partner. I do not expect re-unification as long as Taiwan remains democratic (and it has been since 1991/1996) and China remains a communist dictatorship. Taiwan had a population in 2010 of 23.1 million, and it is growing only very slowly. Macau, with a population of 552,300 in the 2010 census, is effectively under Chinese control, as is Hong Kong (7,097,600 in the 2010 census).
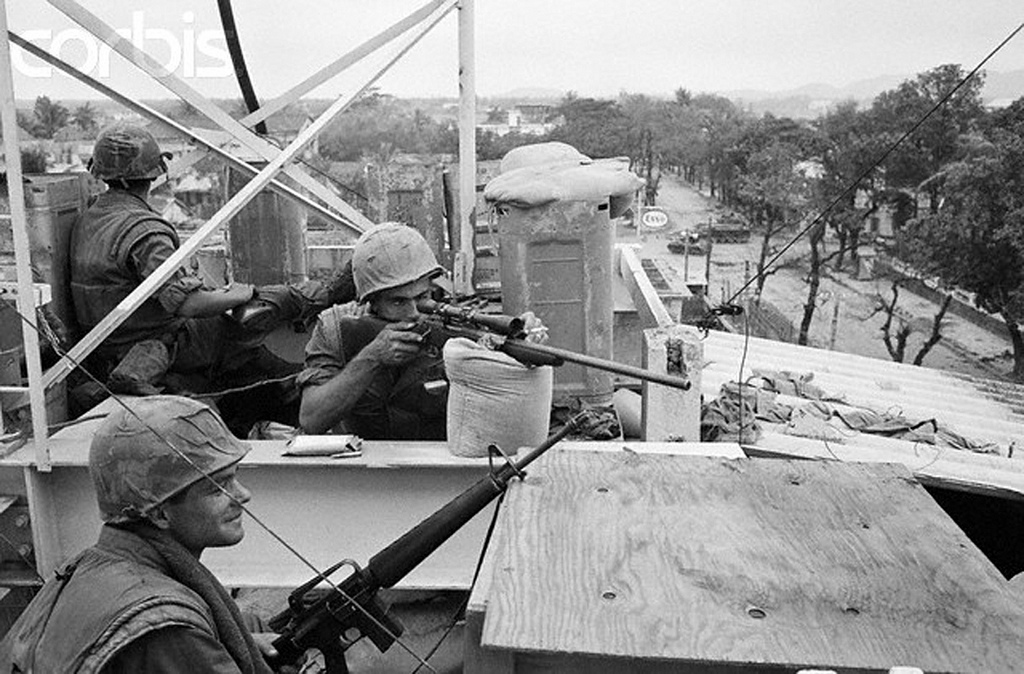
U.S. Army troops in Hue, South Vietnam monitor the streets below during the Tet Offensive, 1968. [Bettmann/CORBIS]
Another part of our Phase III effort was to look at post-World War II cases. This is, by its nature, invariably one-sided data. Maybe at some point we will get the Chinese, North Koreans, Vietnamese, Syrians, etc. to open up their archives to us researchers, but, except for possibly Vietnam, I don’t think that is going to happen any time in the near future. So, we ended up building our post-World War II cases primarily from U.S. data.
We added 10 engagements from the Inchon/Seoul operation in 1950. For Vietnam we added 65 division-level urban engagements from the Tet Offensive in 1968 and 57 division-level non-urban engagements. We also added 56 battalion-level urban engagements from the Tet Offensive (all in Hue). We had 14 division-level urban engagements and 65 division-level non-urban engagements from various contingencies and conventional operations from 1944 to 2003. This included ELAS Insurgency, Arab-Isreali Wars, Panama, Mogadishu, the 1991 Gulf War and Baghdad in 2003. We also added 9 battalion-level urban cases, mostly from Beirut 1982-1984.
To add it all up this was:
Urban Non-urban
Phase I (ETO) 46 91
Phase II (Kharkov/Kursk) 51 65
Phase III (Manila/PTO) 53 41
Post-WWII – Division-level 89 123
Post-WWII – Battalion-level 65 0
——- ——
Total cases 304 319
This is a lot of cases for comparisons.
Just to show how they match up (from page 28 of the report):
Attackers in Division-Level Engagements:
Urban
PTO
Kor
Tet
Oth
ETO
EF (Ger Atk)
EF (Sov Atk)
Avg Str/day
12,099
28,304
6,294
10,903
34,601
17,080
17,001
Avg Cas
78
30
94
254
178
86
371
Avg Cas/day
78
30
39
59
169
86
371
Avg % Loss/day
0.63
0.71
0.78
0.56
0.50
0.49
1.95
Wgt % Loss/day
0.65
0.71
0.62
0.54
0.49
0.50
2.18
Non-urban
PTO
Tet
Oth
ETO
EF (Ger Atk)
EF (Sov Atk)
Avg Str/day
17,445
13,232
18,991
21,060
27,083
27,044
Avg Cas
663
44
377
469
276
761
Avg Cas/day
221
22
191
237
206
653
Avg % Loss/day
0.83
0.19
1.56
1.09
1.00
2.39
Wgt % Loss/day
1.27
0.17
1.01
1.13
0.76
2.41
I will pick up more on the Phase III effort in a subsequent posting (a part 3 to this series). These charts are also on page 238 of War by Numbers.
What are the U.S. Armed Forces’ potential conventional warfare missions? Is conventional warfare gone, leaving the U.S. Army conducting special ops, training, coordinating air and drone strikes, providing counterinsurgency support, and generally just kicking down doors?
Well, there are still a few potential conventional warfare scenarios out there, even if they have a low probability of occurring:
Korea: We still have the majority of the 2nd Infantry Division deployed in Korea as a reserve force for the Republic of Korea (ROK) Army. If a war blows up in Korea, then we are immediately right in the middle of a conventional war. It is 1950 all over again. Amid all the “fire and fury” type comments, I do consider this to be a low odds of occurring. Still, it is one conventional warfare mission that has existed since 1950 and does not appear to be going away.
Taiwan: I don’t think China is going to invade Taiwan (their third largest trading partner), but stranger things have happened. I believe we are informally committed to defend Taiwan if this happens. We have no ground troops there.
Ukraine: We have no commitment to defend Ukraine. On the other hand, if Russia rolls across the border with tanks and is heading towards Kiev, then we may decide we need to intervene. Exactly with what forces we would use is a question, but this is potentially a mission in the future. I don’t think it is likely. If Russia was going to conduct a conventional invasion of Ukraine, it would have done so in 2014.
Baltic States: On the other hand, we do have a commitment to defend the three Baltic States (Latvia, Lithuania and Estonia). They are members of NATO. Right now, with the forces currently in place, a Russian conventional invasion would sweep over these three countries in a matter of days. Then what? The U.S. would be challenged to be able to quickly move a single armored or mechanized division there, let alone the several divisions it would probably take to re-claim them. We currently are not defending them and do not have the ability to quickly re-take them. That said, the odds of Russia doing this is very, very close to zero, because they do end up in a war with 29 nations. This is probably not the best use of their time.
Belarus: On the other hand, I don’t rule out tanks rolling into Belarus at some point in the future. Lukashenko, the Belarus dictator, is 63 years old, and these guys don’t live forever. Once he is gone, will Belorus undergo a calm transition of power to a new president (for life)….or does Russia take this opportunity to reclaim Belarus? Unlike Ukraine, there is not a strong nationalist group that is clearly ready to fight off any Russian invaders. If Russia did decide to take Belarus (probably making sure they were invited, like they were in Afghanistan in 1979), is there anything we could do about it? How concerned would we be about it?
Georgia: Russian already had a five day war with Georgia in 2008. Russia probably could have overrun Georgia if they wanted to. They probably can now. It is a very small country and geographically isolated from NATO. I don’t rule out it becoming a battlefield in the future. Not sure what the United States could do about it.
Iran: While I don’t think that the U.S. will ever invade Iran, I would have said the same thing about Iraq in 2000. Of course, Iran is a country with a population more more than twice that of Iraq. Invading Iraq in 2003 led to lots of long-term complications. Invading Iran might get even more difficult.
The mission not yet named: The last 30 years are notable in that the United States has been dragged into three major wars rather suddenly. At the beginning of 1990, I don’t recall any defense analyst saying the United States was about to enter into a war with Iraq for the sake of saving Kuwait (who we had no alliance with). Yet, less than a year later, this is exactly what we did, and it was done with a large conventional force of nine deployed U.S. divisions. In 2000, I don’t recall too many defense analysts saying that we would soon be invading Afghanistan and Iraq. These missions came rather suddenly. So, one must always assume that there is a possible conventional mission at any time in any place. It has happened twice in the last 30 years. These are hard to plan for and to structure forces for, yet there is clearly a need for a mobile conventional force just in case.
Anyhow, that list appears to cover the possible conventional warfare missions for the United States right now. The one with the highest probability of occurring is “the mission not yet named.” There are many other flash points in the world, but most of them are not ones that would attract American conventional ground forces. Still, as shown by Kuwait in 1990 and Iraq in 2003, we can end up involved in a conventional conflict with very little notice. This is a far cry from the days of the Cold War when the Soviet Union and Warsaw Pact were lined up along the border of Germany. The future ain’t what it used to be, to borrow a quote.
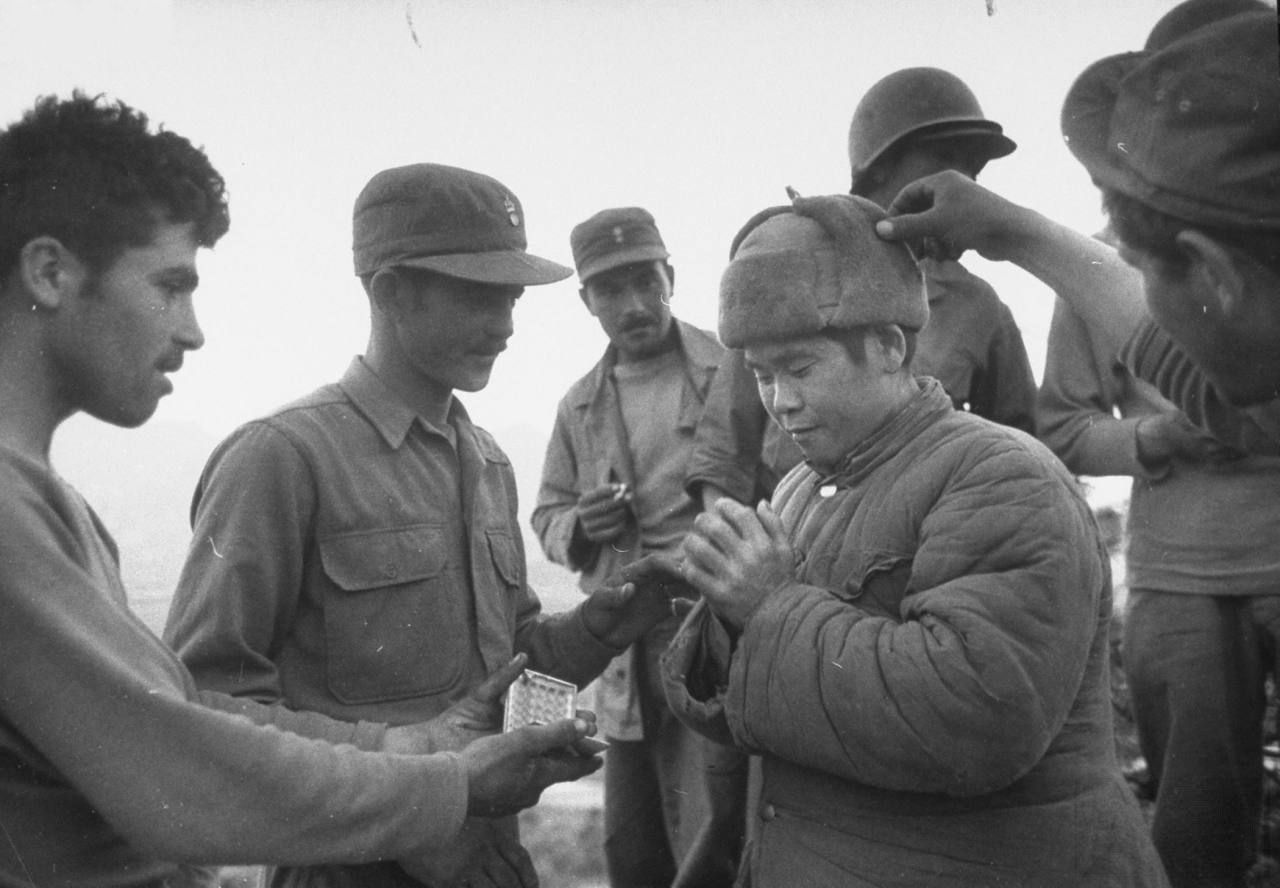
My father was a forward observer in Korea. In 1953, him and another U.S. soldier were camped out in a foxhole between the lines. It was nighttime and they were making dinner.
The U.S. command had requested that its soldiers should try to capture some Chinese soldiers. As added incentive, the people who captured one would get a three-day pass to Japan. This was a pretty good incentive for those living out in the field. So the two foxhole buddies were sitting making dinner and of course talking about what they would do on their three-day pass to Japan, assuming they could capture a Chinese soldier.
Suddenly, a Chinese soldier stuck his head over the rim of the foxhole. They saw him, yelled “There is one” and immediately leaped for him. The poor Chinese soldier took off running. They ran for a mile or two through the “no mans land” between the lines(which would became the DMZ) and eventually the two larger American’s were able to run him down and capture him.
Now, they were in the middle of the (soon be called) DMZ, in the middle of the night, dragging along a captured Chinese soldier, and not quite sure where their foxhole was. Furthermore, in their haste to get him, they forgot to grab their guns. For the two unarmed Americans dragging a Chinese prisoner through the dark, it was a very long and tense walk back to their foxhole.
They did get their three-day pass to Japan.
Note: This is a story told to me by my father many years ago. It was not written down and I have never checked the veracity of it. I have no doubt that it is mostly true, but one cannot rule out a little exaggeration for the sake of a good yarn. We do not know what became of the Chinese soldier.
Not much to say about captured records in the Korea War as I have never checked on them. I assume there must be some taken from North Korean and Chinese units and they are files away somewhere. My father did capture a Chinese soldier during the Korean War.
Oddly enough, there not been much done in the world of quantitative analysis on the Korea War outside of the work that ORO (Operations Research Office) did in the 1950s. We have never done any significant work on the Korean War. In the late 1980s we did explore conducting some analysis of Korean War battalion-level combat. As part of that effort Trevor Dupuy and I went over to the National Archives at Suitland and pulled up some U.S. Army Korea War records. They appeared to be quite complete. There were a couple of French infantry battalions attached to the U.S. Division and we appear to have good strength and loss data for them also.
Later, in 1989, Trevor Dupuy arranged with China to conduct a joint research project. It was funded by OSD Net Assessment (Andy Marshall). Trevor Dupuy really wanted to do some two-sided analysis of combat with the Chinese Army in Korea, but apparently getting access to the Chinese Army records was still too sensitive at that point. So, instead, they arranged to do a joint research contract on a more general and less sensitive theme like perceptions of each sides intentions during the Korean War. But then in June 1989 the Chinese government rolled over the student protestors in Tiananmen Square with tanks. That ended all joint research projects for many years.
We never got back to trying to conduct a joint research project on combat with China. Instead in 1993, we started a research project on Kursk using Russia records.
Trevor Dupuy did mention that the Chinese informally told him that the United States often overestimated the size of the Chinese forces they were facing, and often underestimated the casualties the Chinese took. I have no idea how valid that is.
Anyhow, this is an extended discussion of captured records originally inspired by this post:
I gather the reasons are because of a slow down of demand in China (which is interesting in and of itself) and Libyan oil returning to the market (which is a good sign). Brent Crude is now getting near $50 a barrel, whereas several weeks ago it was at $58.
This, of course, has a big impact in countries like Russia, where oil is a major percent of the government budget (ruble is at 57 to a dollar today) and Venezuela, which is currently in turmoil.