I noted today, via tweet from President Trump, that “..when I asked, how many will die. 150 people, sir, was the answer from a General.”
Now, we have done a few casualty estimates for conflicts: 1) The 1991 Gulf War estimate done by Trevor Dupuy that was briefed to the House Armed Services committee in 1990 and was the source of his book If War Comes, 2) the Bosnia casualty estimate that The Dupuy Institute did for the Joint Chiefs of Staff (JSC) in 1995. This is discussed in depth in Appendix II of America’s Modern Wars, and 3) The Iraq casualty estimate that we did in 2004 for Center of Army Analysis (CAA) and OSD Net Assessment. This is discussed in depth in the first Chapter of America’s Modern Wars. So, we know something about casualty estimation and actually have a documented, provable track record.
We have no idea what casualty estimation was done for a strike or conflict with Iran. We have not been involved in that. Most likely, if a properly developed casualty estimation was done, it was done with a range of results. For example, our Bosnia estimate was that in the case of an extended deployment (which is what was done) it was estimated that there was a 50% chance that U.S. killed from all causes in Bosnia in the first year would be below 17 (12 combat deaths and 5 non-combat fatalities) and a 90% chance U.S. killed would be below 25 (see page 308 in America’s Modern Wars).
So, I am guessing that President Trump was not told that there would be 150 killed, he was probably given a range of estimates, of which that was probably the upper boundary of that range. Still, these numbers get people’s attention. I gave a briefing one morning on our Iraq estimate after a three-day weekend…and as one colonel commented during the briefing “This is a hell of a briefing to wake up to after a long weekend.” (see page 18, America’s Modern Wars).
The phrase “face validation” shows up in our blog post earlier this week on Combat Adjudication. It is a phrase I have heard many times over the decades, sometimes by very established Operation Researchers (OR). So what does it mean?
Well, it is discussed in the Department of the Army Pamphlet 5-11: Verification, Validation and Accreditation of Army Models and Simulations: Pamphlet 5-11
Their first mention of it is on page 34: “SMEs [Subject Matter Experts] or other recognized individuals in the field of inquiry. The process by which experts compare M&S [Modeling and Simulation] structure and M&S output to their estimation of the real world is called face validation, peer review, or independent review.”
On page 35 they go on to state: “RDA [Research, Development, and Acquisition]….The validation method typically chosen for this category of M&S is face validation.”
And on page 36 under Technical Methods: “Face validation. This is the process of determining whether an M&S, on the surface, seems reasonable to personnel who are knowledgeable about the system or phenomena under study. This method applies the knowledge and understanding of experts in the field and is subject to their biases. It can produce a consensus of the community if the number of breadth of experience of the experts represent the key commands and agencies. Face validation is a point of departure to determine courses of action for more comprehensive validation efforts.” [I put the last part in bold]
Page 36: “Functional decomposition (sometimes known as piecewise validation)….When used in conjunction with face validation of the overall M&S results, functional decomposition is extremely useful in reconfirming previous validation of a recently modified portions of the M&S.”
I have not done a survey of all army, air force, navy, marine, coast guard or Department of Defense (DOD) regulations. This one is enough.
So, “face validation” is asking one or more knowledgeable (or more senior) people if the model looks good. I guess it really depends on whose the expert is and to what depth they look into it. I have never seen a “face validation” report (validation reports are also pretty rare).
Who’s “faces” do they use? Are they outside independent people or people inside the organization (or the model designer himself)? I am kind of an expert, yet, I have never been asked. I do happen to be one of the more experienced model validation people out there, having managed or directly created six+ validation databases and having conducted five validation-like exercises. When you consider that most people have not done one, should I be a “face” they contact? Or is this process often just to “sprinkle holy water” on the model and be done?
In the end, I gather for practical purposes the process of face validation is that if a group of people think it is good, then it is good. In my opinion, “face validation” is often just an argument that allows people to explain away or simply dismiss the need for any rigorous analysis of the model. The pamphlet does note that “Face validation is a point of departure to determine courses of action for more comprehensive validation efforts.” How often have we’ve seen the subsequent comprehensive validation effort? Very, very rarely. It appears that “face validation” is the end point.
What we have listed in the previous articles is what we consider the six best databases to use for validation. The Ardennes Campaign Simulation Data Base (ACSDB) was used for a validation effort by CAA (Center for Army Analysis). The Kursk Data Base (KDB) was never used for a validation effort but was used, along with Ardennes, to test Lanchester equations (they failed).
The Battle of Britain Data Base to date has not been used for anything that we are aware of. As the program we were supporting was classified, then they may have done some work with it that we are not aware of, but I do not think that is the case.
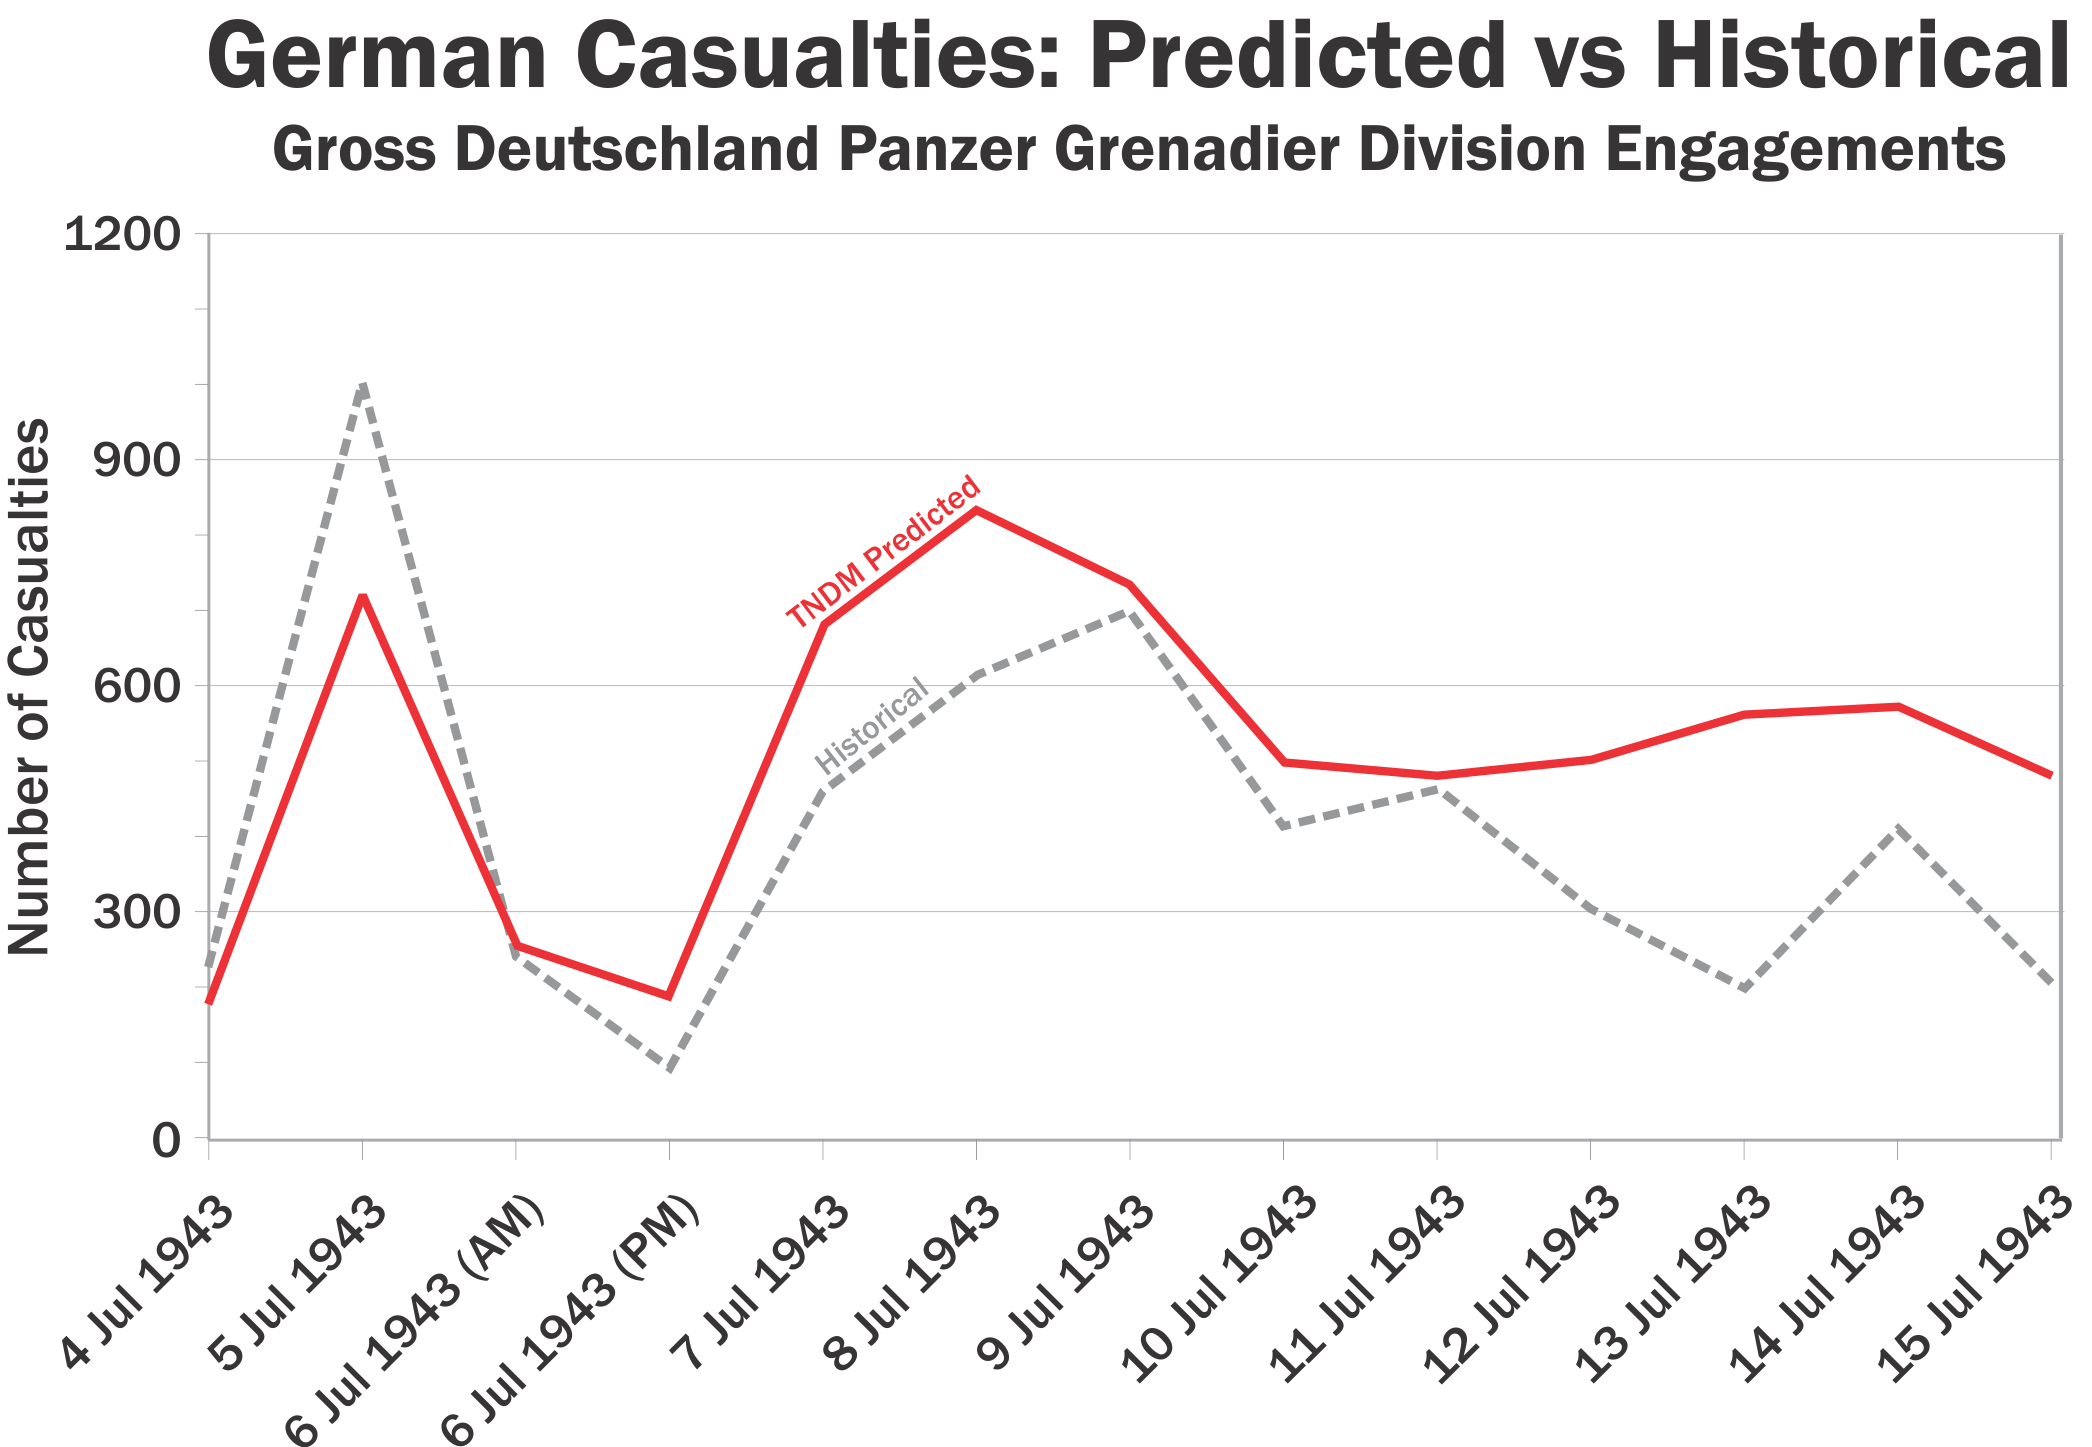
Our three battles databases, the division-level data base, the battalion-level data base and the company-level data base, have all be used for validating our own TNDM (Tactical Numerical Deterministic Model). These efforts have been written up in our newsletters (here: http://www.dupuyinstitute.org/tdipub4.htm) and briefly discussed in Chapter 19 of War by Numbers. These are very good databases to use for validation of a combat model or testing a casualty estimation methodology. We have also used them for a number of other studies (Capture Rate, Urban Warfare, Lighter-Weight Armor, Situational Awareness, Casualty Estimation Methodologies, etc.). They are extremely useful tools analyzing the nature of conflict and how it impacts certain aspects. They are, of course, unique to The Dupuy Institute and for obvious business reasons, we do keep them close hold.
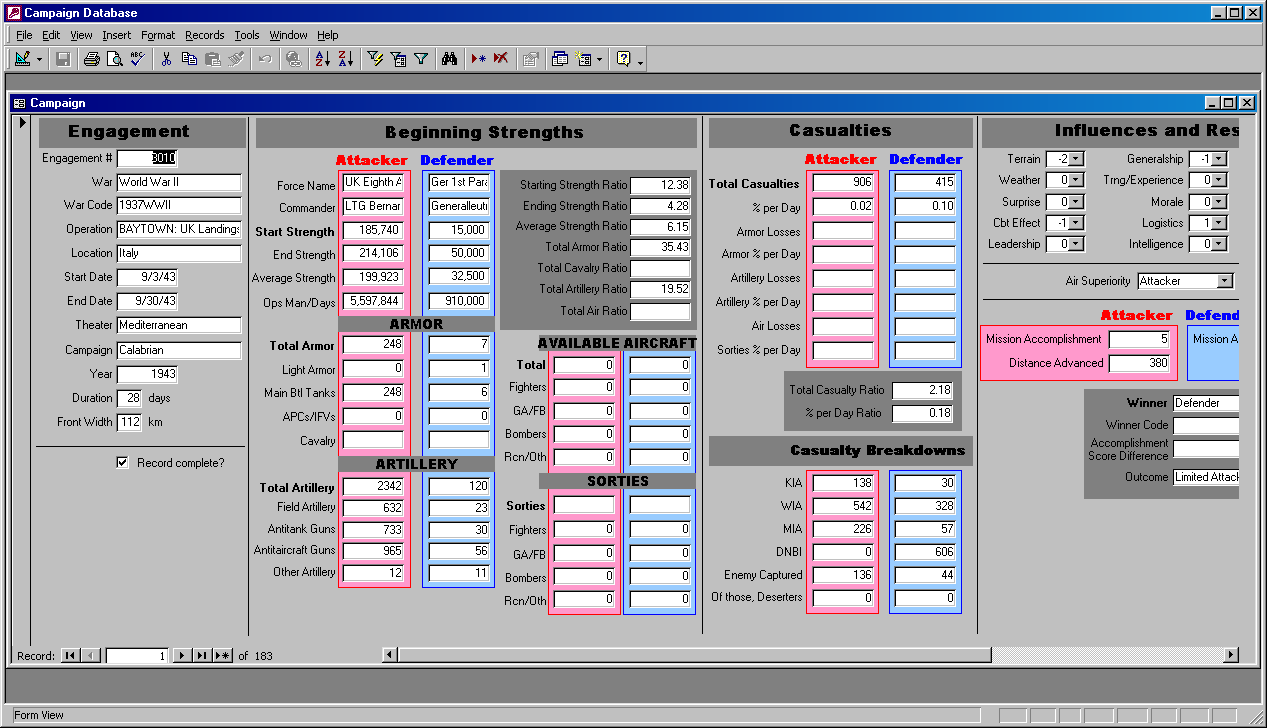
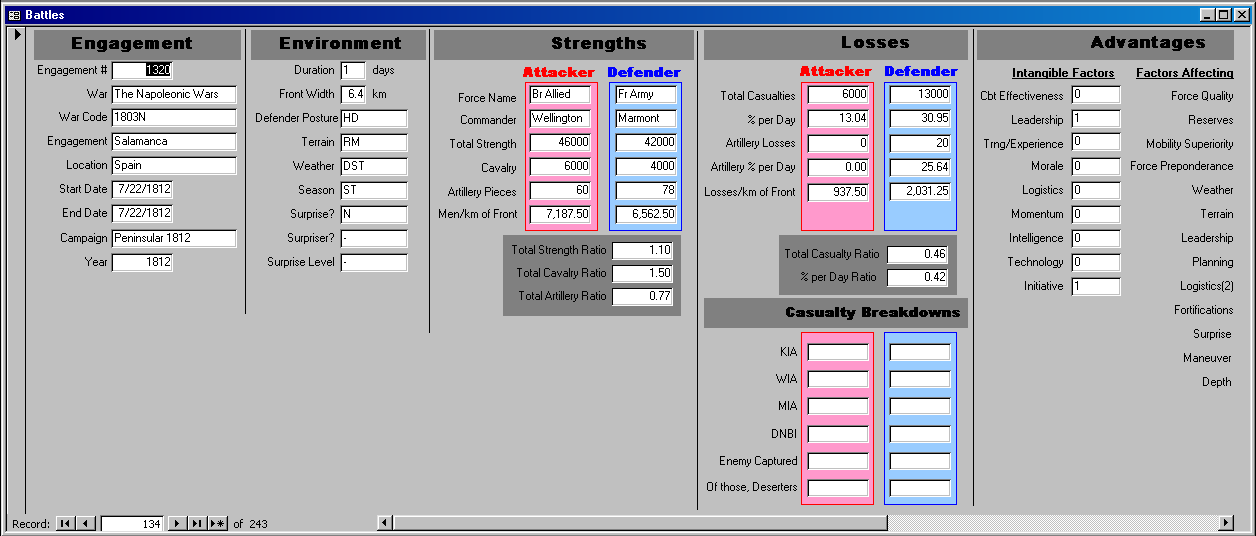
We do have a number of other database that have not been used as much. There is a list of 793 conflicts from 1898-1998 that we have yet to use for anything (the WACCO – Warfare, Armed Conflict and Contingency Operations database). There is the Campaign Data Base (CaDB) of 196 cases from 1904 to 1991, which was used for the Lighter Weight Armor study. There are three databases that are mostly made of cases from the original Land Warfare Data Base (LWDB) that did not fit into our division-level, battalion-level, and company-level data bases. They are the Large Action Data Base (LADB) of 55 cases from 1912-1973, the Small Action Data Base (SADB) of 5 cases and the Battles Data Base (BaDB) of 243 cases from 1600-1900. We have not used these three database for any studies, although the BaDB is used for analysis in War by Numbers.
Finally, there are three databases on insurgencies, interventions and peacekeeping operations that we have developed. This first was the Modern Contingency Operations Data Base (MCODB) that we developed to use for Bosnia estimate that we did for the Joint Staff in 1995. This is discussed in Appendix II of America’s Modern Wars. It then morphed into the Small Scale Contingency Operations (SSCO) database which we used for the Lighter Weight Army study. We then did the Iraq Casualty Estimate in 2004 and significant part of the SSCO database was then used to create the Modern Insurgency Spread Sheets (MISS). This is all discussed in some depth in my book America’s Modern Wars.
None of these, except the Campaign Data Base and the Battles Data Base (1600-1900), are good for use in a model validation effort. The use of the Campaign Data Base should be supplementary to validation by another database, much like we used it in the Lighter Weight Armor study.
Now, there have been three other major historical validation efforts done that we were not involved in. I will discuss their supporting data on my next post on this subject.
[This piece was originally posted on 27 June 2016.]
Previous posts have detailed casualty estimates by Trevor Dupuy or The Dupuy Institute (TDI) for the 1990-91 Gulf War and the 1995 intervention in Bosnia. Today I will detail TDI’s 2004 forecast for U.S. casualties in the Iraqi insurgency that began in 2003.
In April 2004, as simultaneous Sunni and Shi’a uprisings dramatically expanded the nascent insurgency in Iraq, the U.S. Army Center for Army Analysis (CAA) accepted an unsolicited proposal from TDI President and Executive Director Christopher Lawrence to estimate likely American casualties in the conflict. A four-month contract was finalized in August.
The methodology TDI adopted for the estimate was a comparative case study analysis based on a major data collection effort on insurgencies. 28 cases were selected for analysis based on five criteria:
The conflict had to be post-World War II to facilitate data collection;
It had to have lasted more than a year (as was already the case in Iraq);
It had to be a developed nation intervening in a developing nation;
The intervening nation had to have provided military forces to support or establish an indigenous government; and
There had to be an indigenous guerilla movement (although it could have received outside help).
Extensive data was collected from these 28 cases, including the following ten factors used in the estimate:
Country Area
Orderliness
Population
Intervening force size
Border Length
Insurgency force size
Outside support
Casualty rate
Political concept
Force ratios
Initial analysis compared this data to insurgency outcomes, which revealed some startlingly clear patterns suggesting cause and effect relationships. From this analysis, TDI drew the following conclusions:
It is difficult to control large countries.
It is difficult to control large populations.
It is difficult to control an extended land border.
Limited outside support does not doom an insurgency.
“Disorderly” insurgencies are very intractable and often successful insurgencies.
Insurgencies with large intervening third-party counterinsurgent forces (above 95,000) often succeed.
Higher combat intensities do not doom an insurgency.
In all, TDI assessed that the Iraqi insurgency fell into the worst category in nine of the ten factors analyzed. The outcome would hinge on one fundamental question: was the U.S. facing a regional, factional insurgency in Iraq or a widespread anti-intervention insurgency? Based on the data, if the insurgency was factional or regional, it would fail. If it became a nationalist revolt against a foreign power, it would succeed.
Based on the data and its analytical conclusions, TDI provided CAA with an initial estimate in December 2004, and a final version in January 2005:
Insurgent force strength is probably between 20,000–60,000.
This is a major insurgency.
It is of medium intensity.
It is a regional or factionalized insurgency and must remain that way.
U.S. commitment can be expected to be relatively steady throughout this insurgency and will not be quickly replaced by indigenous forces.
It will last around 10 or so years.
It may cost the U.S. 5,000 to 10,000 killed.
It may be higher.
This assumes no major new problems in the Shiite majority areas.
When TDI made its estimate in December 2004, the conflict had already lasted 21 months, and U.S. casualties were 1,335 killed, 1,038 of them in combat.
When U.S. forces withdrew from Iraq in December 2011, the war had gone on for 105 months (8.7 years), and U.S. casualties had risen to 4,485 fatalities—3,436 in combat. The United Kingdom lost 180 troops killed and Coalition allies lost 139. There were at least 468 contractor deaths from a mix of nationalities. The Iraqi Army and police suffered at least 10,125 deaths. Total counterinsurgent fatalities numbered at least 15,397.
As of this date, the conflict in Iraq that began in 2003 remains ongoing.
Thanks to a comment made on one of our posts, I recently became aware of a 17 page discussion thread on combat results tables (CRT) that is worth reading. It is here:
By default, much of their discussion of data centers around analysis based upon Trevor Dupuy’s writing, the CBD90 database, the Ardennes Campaign Simulation Data Base (ACSDB), the Kursk Data Base (KDB) and my book War by Numbers. I was not aware of this discussion until yesterday even though the thread was started in 2015 and continues to this year (War by Numbers was published in 2017 so does not appear until the end of page 5 of the thread).
The CBD90 was developed from a Dupuy research effort in the 1980s eventually codified as the Land Warfare Data Base (LWDB). Dupuy’s research was programmed with errors by the government to create the CBD90. A lot of the analysis in my book was based upon a greatly expanded and corrected version of the LWDB. I was the program manager for both the ACSDB and the KDB, and of course, the updated versions of our DuWar suite of combat databases.
There are about a hundred comments I could make to this thread, some in agreement and some in disagreement, but then I would not get my next book finished, so I will refrain. This does not stop me from posting a link:
This series of posts was based on the article “Iranian Casualties in the Iran-Iraq War: A Reappraisal,” by H. W. Beuttel, originally published in the December 1997 edition of the International TNDM Newsletter. Mr Beuttel was a former U.S. Army intelligence officer employed as a military analyst by Boeing Research & Development at the time of original publication. He also authored several updates to this original article, to be posted at a later date, which refined and updated his analysis.
[This post is based on “Iranian Casualties in the Iran-Iraq War: A Reappraisal,” by H. W. Beuttel, originally published in the December 1997 edition of the International TNDM Newsletter.]
If we estimate that at least 5,000,000 troops (about 12% of Iran’s then population) served in the war zone, then the military casualty distribution is not less than the following (Bold indicates the author’s choice from ranges):
Killed in Action/Died of Wounds: 188,000 (156,000-196,000) (17%)
Wounded in Action: 945,000 (754,000-1,110,000) (83%)
Severely Wounded/Disabled: 200,000 (18%) (Note: carve out of total wounded)
Missing in Action: 73,000 (6%) (Note: Carve out of total KIA plus several thousand possible defectors/collaborators)
PoW: 39,000-44,000
Total Military Battle Casualties (KIA + WIA): 1,133,000-1,302,000 (28% theater rate)
Possible Non-Battle Military Deaths: 74,000
Non-Battle Military Injuries: No idea.
With Civilian KIA (11,000) and WIA (34,000) and “chemical” (45,000) Total Hostile Action Casualties: 1,223,000
Possible Military Non-Battle Deaths (74,000):1,297,000
Total Deaths Due to the Imposed War: 273,000 (104% of Pentagon estimate of 262,000)
Of 5,000,000 estimated Iranian combatants (1 million regular army, 2 million Pasdaran, 2 million Baseej)
~ 4% were Killed in Action/Missing in Action
~ 4% were Disabled
~ 13% were Wounded
~ 1% were Non-Battle Deaths
~ 1% were PoWs
Total military losses all known causes ~ 27%
The military battle casualty total percentile (27%) is intermediate between that of World War I (50% ~ British Army) and World War II (13% ~ U.S. Army/U.S. Marine Corps, 22% British Army).[118]
The author acknowledges the highly speculative nature of much of the data and argument presented above. It is offered as a preliminary starting point to further study. As such, the author would appreciate hearing from anyone with additional data on this subject. In particular he would invite the Government of the Islamic Republic of Iran to provide any information that would corroborate, correct or expand on the information presented in this article.
[This post is based on “Iranian Casualties in the Iran-Iraq War: A Reappraisal,” by H. W. Beuttel, originally published in the December 1997 edition of the International TNDM Newsletter.]
The Iran-Iraq War produced remarkably few civilian casualties compared to World War I or World War II rates. UNICEF data suggests that prior to World War I, civilians accounted for only 5% of all deaths in a given war. This rose to 15% in World War I and an astounding 65% in World War II.[113] Iran claims 11,000 civilian deaths as a result of the war primarily through Iraqi air and missile strikes. The author‘s own study of Iranian civilian deaths places it at about 8,800 known deaths, indicating this number is probably very close to the true figure. If so, civilian deaths accounted for just 5% of total war dead, a turn-of-the-century standard. The number of wounded has not been released, but this author’s figures can account for over 34,000 civilian wounded by air and missile strikes. Further, Iran claims 45,000 civilian “chemical” casualties. If all claims are true then approximately 90,000 civilians became casualties of the war.
This yields a military to civilian casualty ratio of 11:1. This is far better than the ratio claimed in recent wars of 1:9. This suggests that despite the hysteria surrounding “War of the Cities,” the Iranian civilian population was not severely at risk during the war. Compare this to World War II England where the one-year German V-1/V-2 campaign killed 8,588 and wounded 46,838.[114] Then contrast it to total English civilian casualties during World War II at 60,000 dead and 86,800 wounded due to the blitz and buzz bombs. U.K. military killed, wounded and missing (excluding PoW) were 582,900 in World War II giving a military-to-civilian casualty ratio of 4:1.[115] Of course the World War II German bombing and missile campaigns against England were far more severe than that experienced by Iran at the hands of Iraq.
Civilian chemical casualties match military in magnitude. At first this might seem strange. I have found no World War I data on military-to-civilian casualty ratios as regards chemical agents, so there is no point of comparison or contrast here. The high number of civilian chemical casualties seems to be a function of several factors. First some 2,000 Iranian towns and villages lay in areas where Iraqi forces employed chemical weapons.[116] Secondly, Iraqi chemical strikes were often delivered deep into Iranian rear areas to attack reinforcements and support troops. Casualties were often high as the rear echelon troops were less well equipped and prepared to cope with chemical attacks.[117] In these rear area attacks the civilian population density must have been much higher than on the front line. Further, civilians probably had no means of chemical defense. Witness the chemical attack on Halabja in March 1988 with mustard, nerve and cyanogen chloride which killed some 4,000-5,000 civilians and maimed 7,000 others, This may explain the 1:1 relationship between overall Iranian military and civilian chemical casualties.
Mr. Beuttel, a former U.S. Army intelligence officer, was employed as a military analyst by Boeing Research & Development at the time of original publication. The views and opinions expressed in this article do not necessarily reflect those of The Boeing Company.
NOTES
[113] Abstracts Obtained from Iran on Medical Research Conducted After the 1980-1988 Iran-Iraq War,” www.chronicillnet.org/PGWS/tuite/IRMED/IRANTOC.html
[This post is based on “Iranian Casualties in the Iran-Iraq War: A Reappraisal,” by H. W. Beuttel, originally published in the December 1997 edition of the International TNDM Newsletter.]
The War of Sacred Defense was the only conflict of the 20th Century other than World War I fought under conditions of general chemical release. The Iranian ground forces were generally ill-prepared for chemical defense, during the course of the war much NBC defense gear was purchased from the U.K., Germany, and Czechoslovakia, but there was never enough and NBC [nuclear, biological, chemical] defense training was insufficient. Many Iranian solders became gas casualties because they did not shave often enough to allow their protective masks to make a tight seal.[88]
Throughout the war Iraq employed chemical weapons against Iranian forces 195 times. After the chemical attack on Halabja in March 1988 killed some 4,000-5,000 civilians and maimed 7,000 others, the IRGC sent a video crew to document the atrocity. The video was used as a training film for Iranian recruits. Instead of instilling hatred for Saddam’s brutality, the film demoralized its viewers and exaggerated the power of Iraqi chemical weapons.[89] Iranian troops later panicked under gas attack conditions at Fao and Majnoon and abandoned their positions. However, this phenomenon was widespread in the First World War.[90] Further, chemical attacks were usually not significantly lethal. This is again in accord with World War I experience. Gas inflicted 70,552 casualties on the American Expeditionary Force in 1917-18. Of these only 1,221 died (2% lethality). The British Army suffered 185,706 gas casualties of which only 5,899 died (3% lethality), Total British battle casualties for World War I were 677,515 KIA and 1,837,613 WIA. Gas accounted for only 7% of all British casualties and only 1% of all KIA. The Russian Anny suffered an amazing 600,000 gas casualties with a lethality rate at times as much as 12%.[91]
The Use Of Gas In The Iran-Iraq War
Iraq may have first used gas in late 1980 near Salamcheh. Iran reported its first chemical casualty in fighting near Hoveyzeh in early 1981. These early attacks seem to have been limited to the riot control agent CS. On 27 October 1982, near Musain, four Iranian soldiers died from toxic chemical exposure, probably mustard gas. In mid-August 1983 Iran suffered 318 casualties from mustard and arsenic agents. On 7, 9, and 13 November 1983, Iraq used mustard in the Panjwin area. Four seriously wounded Iranian soldiers later died in European hospitals.[92] Between May 1981 and March 1984, Iran claimed Iraq had employed chemical weapons on forty-nine different occasions. This had resulted in 1,200 Iranian dead and 5,000 wounded.[93] Mycotoxins may also have been used.[94] On 17 March 1984 Iraqi forces employed gas which caused 400 Iranian casualties, 40 of which were from nerve agents.[95] In the Badr operation (1-18 March 1985) Iraq used chemical weapons five times, but inflicted only 200 Iranian casualties, none apparently fatal.[96] In one unnamed 1985 attack, Iran claimed 11,000 troops were exposed to Iraqi chemical agents.[97] In Wal Fajir-9 (15 February-11 March 1986) Iran claimed 1,800 chemical casualties from a total of about 30,000.[98] Up to 8,500 Iranian soldier were gas casualties by the end of Wal Fajir-8 and Wal Fajir-9 (15 February-19 May 1986) with about 700 killed or seriously wounded.[99] In attacks on 27 and 30 January, 9, 10, 12, and 13 February 1986, 8,500 Iranian gas casualties were reportedly suffered, of which 35 died and 2,500 had to be hospitalized.[100] In Karbala-4 (24-26 December 1986) only five Iranian troops died from toxic gas out of 10,000 battle casualties.[101] By early 1987, chemical weapons had inflicted at least 10,000 Iranian casualties.[102] In all Iran had suffered 25,600 gas casualties by April 1988, of which 260 (sic 2,600?) died. Iraq’s extensive use of chemical agents in the final months before the August 1988 cease-fire may have raised the casualty count to as much as 45,000.[103] In the Iraqi “In God We Trust” offensive of June 1988 against Majnoon, Iran claimed sixty soldiers killed and 4,000 wounded by Iraqi chemical weapons, which included nerve and blood agents.[104] A small U.K. article on mustard gas from the Internet cites 5,000 Iranian troops killed by gas and 40,000-50,000 injured during the war.[105] The overall cumulative wartime pattern of Iranian military chemical casualties is illustrated in the below figure.
The Lethality Of Gas
Speaking in 1996, Abdollah Mazandarani, Secretary General of the Iranian Foundation for Chemical Warfare Victims, claimed 25,000 Iranian soldiers were “martyred” (killed?) by Iraqi use of chemical weapons in operations Wal Fajir-8, Karbala-8, Badr, Fao, and Majnoon. 45,000 civilians were also affected by chemical weapons.[106] Iran claims at least 100,000 wounded by chemical weapons during the imposed war with Iraq. 1,500 of these casualties require constant medical attention to this day. Since 1991, 118 have died as a result of their toxic chemical exposure according to Hamid Sohralr-Pur, head of the Foundation of the Oppressed and Disabled’s Center for Victims of Chemical Warfare.[107] One of these was Reza Alishahi, who died in September 1994 after suffering 70% disability when he was gassed during the Wal Fajir offensives of 1987.[108] Another pathetic story is that of Magid Azam, now a 27-year-old medical student, who was a 16-year-old Baseej fighter gassed with mustard in the Karbala-5 offensive of January 1987 with no apparent permanent effects. In 1995 his health suddenly began to deteriorate so rapidly he required intensive care. His lungs are now so damaged that only a transplant can save his life. He is one of 30,000 Iranian veterans who have received treatment for recurring or delayed reactions to chemical weapons. It is estimated that up to 100,000 Iranian soldiers were exposed to toxic agents during the war.[109]
In the First World War toxic chemical agents accounted for only 4-5% of total casualties. Of 1,296,853 known chemical casualties in that conflict, 90,080 died (7%), 143,613 were badly wounded (11%) and the remaining 1,053,160 (82%) not seriously affected.[110] 25,000 Iranian military dead out of 45,000 chemical casualties gives an incredible chemical lethality rate of 56%, higher than that for land mines. This claim of 25,000 Iranian troops “martyred” is not an exaggeration, but rather a probable misprint.[111] Elimination of an extraneous zero makes the number 2,500, in line with previously released figures. This would give a chemical lethality rate of 6% per chemical casualty, remarkably close to the World War I general rate, although somewhat higher than individual U.S. or British experience. Further, 45,000-55,000 military chemical casualties out of 1,133,000 total combat casualties yields a 4% casualty total for chemical weapons, again in line with overall World War I experience. 2,500 dead from chemical weapons is only 1% of total Iranian KIA. If 5,000 cited above is correct, about 3%. A representative sample of 400 chemical warfare casualties treated at the Labbati-Nejad Medical Center in Tehran in early 1986 yielded 11 deaths (3%) and 64 (16%) very seriously injured.[112]
Mr. Beuttel, a former U.S. Army intelligence officer, was employed as a military analyst by Boeing Research & Development at the time of original publication. The views and opinions expressed in this article do not necessarily reflect those of The Boeing Company.
[90] G. M. Hammerman et al., Impact of the Introduction of Lethal Gas on the Combat Performance of Defending Troops, Fairfax VA: Data Memory Systems Inc., 1985, Contract No. DNA 001-84-C-0241.
[91] Charles E. Heller, Chemical Warfare in World War I: The American Experience 1917-1918, Leavenworth Papers No. 10, Ft Leavenwoth, KS: Combat Studies Institute, 1984, pp. 33, 91-92. This represented some 32% of all hospitalized AEF casualties in World War I. Only about 200 were killed in action outright by gas. U.S. troops were ill prepared, poorly equipped and inadequately trained to fight on the European chemical battlefield. See Denis Winter, Death’s Men: Soldiers of the Great War, London: Penguin Books, 1978, p.125.
[92] Cordesman, The Lessons of Modem War Volume II, pp. 188, n. 23, 513-518.
[93] Edgar O’Ballance, The Gulf War, London: Brassey’s, 1988, p. 149; Peter Dunn, “The Chemical War: Journey to Iran,” NBC Defense and Technology International, April 1986, pp. 28-37.
[95] Dunn, “The Chemical War: Journey to Iran,” pp. 28-37.
[96] O’Ballance, The Gulf War, p. 164.
[97] “Iranians Still Suffering from Saddam‘s Use of Mustard Gas in War,” Buffalo News, 23 November 1997.
[98] O’Ballance, The Gulf War, p. 179.
[99] Cordesman, The Lessons of Modem War Volume II, pp. 224; Peter Dunn, “The Chemical War: Iran Revisited – 1986,” NBC Defense and Technology International, June 1986, pp. 32-37.
[100] “Iran Keeps Chemical ‘Options’ Open; Claims to Have Upper I-land,” NBC Defense and Technology International, April 1986, pp. 12-13.
[101] O’Ballance, The Gulf War, p. 193.
[102] Cordesman, The Lessons of Modem War Volume II, p. 264, n. 39.
[106] “Official Says Germany, U.S. and Britain were Main Suppliers of Chemicals to Iraq,” IRNA, 1 December 1996.
[107] “I18 Iranian Chemically Wounded War Veterans Martyred Since 1991,” IRNA, 17 April 1997.
[108] “Latest Victim of Iraqi Chemical Warfare Against Iran Dies,” IRNA, 27 September 1994.
[109] “Iranians Still Suffering from Saddam’s Use of Mustard Gas in War,” Buffalo News, 23 November 1997.
[110] Ian V. Hogg, Gas, New York: Ballantine Books, 1975, p.136.
[111] This report was taken from the intemet where sometimes an extraneous number appears in figures. Such was the case when another report stated that 9974 Iraqi PoWs had been released in 1996, when the true figure was 974.
[112] Dunn, “The Chemical War: Iran Revisited – 1986,” pp. 32-39.
[This post is based on “Iranian Casualties in the Iran-Iraq War: A Reappraisal,” by H. W. Beuttel, originally published in the December 1997 edition of the International TNDM Newsletter.]
No official Iranian figures of overall wounded have been released to this author’s knowledge. Major General Rezai in the interview cited above mentioned some 200,000 permanently disabled. For reasons given above, this probably represents all components, not just Pasdaran forces. Given the standard 4:1 wounded-to-killed ratio, Iranian wounded must have been about 752,000. This gives a total battle casualty sum of right at 940,000. A problem is we have no data on Died of Wounds (DoW) as a category. Also the war was one of general chemical release which biases figures somewhat as the experience of World War I shows.
If the official Iranian figures are only rigorous KIA (death within one hour and counting 72,754 MIAs as KIAs) then using a “World War I w/gas” planning factor the ratio of wounded-to-killed would be 5.96 indicating about 1,120,480 “wounded.” This is probably high as the blanket Iranian casualty figures for deaths probably include both KIA and DoW.
If we consider the Iranian figures to indicate both KIA and DOW the “World War I w/gas” ratio of surviving wounded to KIA and DOW of 4.1 yields 770,800 “surviving wounded.”
The average of these latter two figures is on the order of 945,440 wounded. This produces a ratio of 5:1. It seems reasonable that this average is closest to the truth.
Another clue to total Iranian wounded comes from the statistics of the Khuzistan Blood Transfusion Center. During the war the center provided 736,284 units of blood and blood products for both combatants and civilian patients in the province. The center itself produced 501,639 of the units.[83] In World War II, 10-12% of wounded were transfused with an average usage of 4.3 units of blood per patient.[84] It is likely the center used the majority of its blood products for combatants. If the 501,639 units it produced itself was so used with the remainder procured for the civilian population, applying World War II standards the total number of wounded transfused would be: 501,639/4.3 = 116,660. This in tum might represent 12% of total wounded. Back calculating gives 116,660/12 * 100 = 972,168. This is very close to the above estimate of 945,000 surviving wounded. It, however, may be high as it would probably include a substantial number who received transfusion, but died of wounds.
One last observation—the Iranians tried to make extensive use of Medevac [medical evacuation] helicopters during the war similar to U.S. Army practice in Viet Nam. In the latter conflict the ratio of KIA and DoW to surviving wounded was 4.16, very close to the “World War I w/gas” planning factor of 4.1.[85] However, the Medevac solution was not completely feasible as it did not suit Iranian climatic and geographic situations. As a result the Iranians built a series of underground clinics immediately behind the front lines which offered the best and most expeditious medical service to their wounded according to Brigadier General Abolqasem Musavi, chancellor of the Iranian Army Medical University. This system allowed speedy evacuation and treatment of wounded even in mass casualty situations.[86]
Given that the Iranian Army suffered on the order of 1,133,000 casualties in the War of Sacred Defense what else does this tell us about the conflict?
First, the average annual “theater” battle casualties would be approximately 28% or 141,000 battle casualties per year (given that the Iranians had about 500,000 troops committed at any one time). This rate is only little over half that of World War I although about 50% higher than that of World War II. As far as U.S. wars are concerned it most resembles that of the U.S. Civil War (24.6%).
The distribution of casualties is also in accordance with modern experience since 1945. The dead (188,000) represent about 17%, severely wounded (200,000) about 18%, and other wounded (745,000) about 65%. This matches closely with T. N. Dupuy’s historically derived distribution of modern war casualties of 20% KIA, 15% severely wounded and 65% other wounded.[87]
Mr Beuttel, a former U.S. Army intelligence officer, was employed as a military analyst by Boeing Research & Development at the time of original publication. The views and opinions expressed in this article do not necessarily reflect those of The Boeing Company.
NOTES
[83] “Kuzistan’s Blood Transfusion Center’s Effectiveness Role in Hygiene and War,” abstract contained in “Abstracts Obtained from Iran on Medical Research Conducted After the 1980-1988 Iran-Iraq War,” www.chronicillnet.org/PGWS/tuite/IRMED/IRANTOC.html.[Dead link, August 2018]
 This series of posts was based on the article “Iranian Casualties in the Iran-Iraq War: A Reappraisal,” by H. W. Beuttel, originally published in the