There are ten references to “Dupuy” in the guide, which I believe is a first. I do not recall any previous Army manual referencing Trevor Dupuy’s work, even though I have seen his work in a manual or two without reference. It is nice that they have properly acknowledged his work.
The references are on:
Page xi: “Acknowledgements”: four references, two for Colonel Trevor N. Dupuy and two to his son Arnold C. Dupuy,. Ph.D.
Page 220: Table D-6. Division opposed rates of advance (km/day). I will have more comments about this table later.
Page 285. Paragraph G-162, Casualty Estimates: Two references. I will probably have a blog post about this later.
Page 402. References: Three references. I will probably have a blog post about this later also.
The two Trevor N. Dupuy books referenced in the Staff Reference Guide are the still out of print Numbers, Predictions & War (1979) and Attrition: Forecasting Battle Casualties and Equipment Losses in Modern War (1995). We still have 40 or so copies of Attrition for sale. See http://www.dupuyinstitute.org/booksfs.htm
The Dupuy Institute does occasionally make use of a combat model developed by Trevor Dupuy called the Tactical Numerical Deterministic Model (TNDM). That model is a development of his older model the Quantified Judgment Model (QJM).
There is an impression, because the QJM is widely known, that the TNDM is heavily involved in our work. In fact, over 90% of our work has not involved the TNDM. Here a list of major projects/publications that we done since 1993.
Based upon TNDM:
Artillery Suppression Study – study never completed (1993-1995)
Air Model Historical Data feasibility study (1995)
Support contract for South African TNDM (1996?)
International TNDM Newsletter (1996-1998, 2009-2010)
TNDM sale to Finland (2002?)
FCS Study – 2 studies (2006)
TNDM sale to Singapore (2009)
Small-Unit Engagement Database (2011)
Addressed the TNDM:
Bosnia Casualty Estimate (1995) – used the TNDM to evaluate one possible scenario
Casualty Estimation Methodologies Study (2005) – was two of the six methodologies tested
Data for Wargames training course (2016)
War by Numbers (2017) – addressed in two chapters out of 20
Did not use the TNDM:
Kursk Data Base (1993-1996)
Landmine Study for JCS (1996)
Combat Mortality Study (1998)
Record Keeping Survey (1998-2000)
Capture Rate Studies – 3 studies (1998-2001)
Other Landmine Studies – 6 studies (2000-2001)
Lighter Weight Armor Study (2001)
Urban Warfare – 3 studies (2002-2004)
Base Realignment studies for PA – 3 studies (2003-2005)
Chinese Doctrine Study (2003)
Situational Awareness Study (2004)
Iraq Casualty Estimate (2004-2005)
The use of chemical warfare in WWI – feasibility study (2005?)
Battle of Britain Data Base (2005)
1969 Sino-Soviet Conflict (2006)
MISS – Modern Insurgency Spread Sheets (2006-2009)
Our bread and butter was all the studies that “did not use the TNDM.” Basically the capture rate studies, the urban warfare studies and the insurgencies studies kept us steadily funded for year after year. We would have not been able to maintain TDI on the TNDM. We had one contract in excess of $100K in 1994-95 (the Artillery Suppression study) and our next TNDM related contract that was over $100K was in 2005.
I was on the phone with someone earlier today and he told me that Attrition: Forecasting Battle Casualties and Equipment Losses in Modern War was on sale on Amazon.com for only $900. I took a look, and sure enough, they have used one for $121.00 and a new one $890. That is it.
(Standard rate in percent*) x (factor based on force size) x (factor based upon mission) x (opposition factor based on force ratios) x (day/night) x (special conditions**) = percent losses.
* Different for attacker (2.8%) and defender (1.5%)
** WWI and certain forces in WWII and Korea
For the attacker the highest this percent can be in one day is 13.44% not counting the special conditions, and the highest it can be for the defender is 5.76%.
The current Tactical Numerical Deterministic Model (TNDM) methodology is:
(Standard personnel loss factor*) x (number of people) x (factor based upon posture/mission) x (combat effectiveness value (CEV) of opponent. up to 1.5) x (factor for surprise) x (opposition factor based on force ratios) x (factor based on force size) x (factor based on terrain) x (factor based upon weather) x (factor based upon season) x (factor based upon rate of advance) x (factor based upon amphibious and river crossings) x (day/night) x (factor based upon daily fatigue) = Number of casualties
* Different for attacker (.04) and defender (.06)
The special conditions mentioned in Numbers, Predictions, and War are not accounted for here, although it is possible to insert them, if required.
All these tables have been revised and refined from Numbers, Predictions, and War.
In Numbers, Predictions and War, the highest multiplier for size was 2.0, and this was for forces of less than 5,000 men. From 5,000 to 10,000 is 1.5 and from 10,000 to 20,000 is 1.0. This formulation certainly fit the data to which the model was validated.
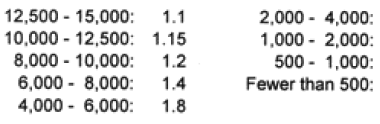
The TNDM has the following table for values below 15,000 men (which is 1.0):
The highest percent losses the attacker can suffer in a force of greater than 15,000 men in one day is “over” 100%. If one leaves out three large multipliers for special conditions—surprise, amphibious assault, and CEV—then the maximum percent losses is 18%. The multiplier for complete surprise is 2.5 (although this degraded by historical period), 2.00 for amphibious attack across a beach, and 1.5 for enemy having a noticeable superior CEVs In the case of the defender, leaving out these three factors, the maximum percent casualties is 21.6% a day.
This means at force strengths of less than 2,000 it would be possible for units to suffer 100% losses without adding in conditions like surprise.
The following TNDM tables have been modified from the originals in Numbers, Predictions, and War to include a casualty factor, among other updates (numbers in quotes refer to tables in the TNDM, the others refer to tables in Numbers, Predictions, and War):
As far as I can tell, Table “20”: Maximum Depth Factor has a very limited impact on the model outcomes. Table “1”: OLIs, has no impact on model outcomes
I have developed a bad habit, if I want to understand or know something about the TNDM, to grab my copy of Numbers, Predictions, and War for reference. As shown by these attrition calculations, the TNDM has developed enough from its original form that the book is no longer a good description of it. The TNDM has added in an additional level of sophistication that was not in the QJM.
The TNDM does not have any procedure for calculating combat from before 1900. In fact, the TNDM is not intended to be used in its current form for any combat before WWII.
Well, I got my hopes up that the Department of Defense modeling and simulation community was finally going to be forced, kicking-and-screaming, to move forward; ensuring that their models were properly validated, not build upon a “base of sand” and making sure they are not assembled like some “house of cards.” This was to come about through four paragraphs in the Senate’s initial markup of the National Defense Authorization Defense Act (NDAA) of 2020 that instructed DOD to assemble a team “..to assess the quality of these models and make recommendations…not later than December 31, 2020.”
Well, it looks like this is not going to happen !!!
According to a little research done by Shawn Woodford, it turns out that that modeling and simulation validation proposal in the original Senate Armed Services Committee report for the 2020 NDAA dated 11 June 2019 did not make it to the final Senate 2020 NDAA bill, passed on 2 July 2020. The proposal was also not included in the House version. The House and Senate versions are now being reconciled in committee and the final 2020 NDAA will probably be approved soon now that there is a general bi-partisan overall budget agreement. There will be a defense budget, but, it appears that it won’t address validation. There is a slim possibility this could change if it is added back in by committee at the last minute.
We would love to know who got those four paragraphs placed into the original Senate NDAA mark-up to start with; and afterwards, why they were then stripped out of the final bill. Clearly someone felt it was important enough to be put in there (as do we). We do not know who those “someone” are. And….who was it that stepped in from wherever and made sure those four paragraphs were removed?
If anyone knows anything further about this, please let us know.
The phrase “house of cards” we used in a report we did on casualty estimation methodologies (Casualty Estimation Methodologies Studies, 25 July 2005, The Dupuy Institute, page 32). To quote:
In 1991, Paul Davis and Donald Blumenthal employed the term “base of sand” to describe the essential modeling problem of the day. They described one of the core problems as a lack of a vigorous military science.
Unfortunately, this was the responsibility of the operations research community. Understanding military science was part of what ORO [Operations Research Office] was attempting to do in its early days. It was the operations research community who proposed the models, felt they could develop models, sold them to the military, spent the budget and finally produced the models built upon a “base of sand.” As such, they are the community that needs to correct the problem and produce this theory of combat. They are the scientists.
Yet, the problem is bigger than a “base of sand.” This phrase implies that there is a shortfall of data to start with. Yet every complex model (and most of these models are complex) is built from a number of interrelationships within the model. This is even more so for hierarchy of model structures. Each of these inter-relationships, which are often model unique constructs, is often built upon “expert judgment.” Therefore, the “base of sand” does not just start at the bottom, but carries through to each individual function within a model. As such, what has been built upon this “base of sand” is a “house of cards.”
We’re like policemen. We’re not fighting a war. If we wanted to fight a war in Afghanistan and win it, I could win that war in the week. I just don’t want to kill 10 million people.
I have plans on Afghanistan that if I wanted to win that war, Afghanistan would be wiped off the face of the earth. It would be gone, it would be over literally in 10 days.
Well, to start with it is pretty hard to kill 10 million people. We won’t discuss the six or so cases where people actually succeeded in doing this, they are pretty well known. None of them were done in 10 days. It would appear that the only way you could cause such havoc in 10 days would be through a massive nuclear attack. It would have to be fairly extensive attack to kill 10 million of the 35 million people in Afghanistan, especially as they are somewhat dispersed.
Is someone actually discussing this possibility inside the White House or Pentagon? I seriously doubt it.
Now, I have never been involved in estimating losses from a nuclear attack. It can be done. Each bomb or missile has a lethal radius, a less-than-lethal radius, and of course, there is radiation poisoning, nuclear fallout, and a rather extended long-term series of illnesses, as the survivors of Hiroshima and Nagasaki could recount in painful detail. It would certainly require dozens of nuclear bombs. The U.S. has around 1,800 deployed nuclear warheads.
He also said:
If we wanted to, we could win that war. I have a plan that would win that war in the very short period of time.
I do find that hard to believe, as large insurgencies have been particularly intractable. See page 47 of my book America’s Modern Wars: Understanding Iraq, Afghanistan and Vietnam.
Seeing how the word “Lethality” has developed a life of its own….I decided to take a look at what was discussed on lethality in my book War by Numbers. Just to clarify, I have never considered how “lethality” should be defined or what its definition should consist of, but simply used the word as commonly used in American English.
I ended up discussing lethality in two chapters of my book: Chapter 13: The Effects of Dispersion on Combat, and Chapter 15: Casualties.
In Chapter 13: The Effects of Dispersion on Combat, I discuss it only the most general way. For example: “The effectiveness and lethality of weapons have continued to increase over the past four hundred years, yet the loss rates among forces in combat have declined.” (page 161) and “He postulated that forces continued to disperse over time to compensate for the increased lethality of weapons.” (also page 161). This chapter, pages 161-173, should probably be read by anyone looking to discuss “lethality.”
In Chapter 15: Casualties, I discuss lethality as related to wounded-to-killed ratio and specific weapons that wound and/or kill. There is an entire section in the book called “Lethality of Weapons” (page 183). This looks at the percent of people killed among those wounded by weapon. So there are multiple tables showing the “Lethality of Weapon,” some drawn from the Textbook of Military Medicine. This is a fairly extended discussion that addresses the lethality of weapons over multiple weapons over multiple wars. It then morphs into a discussion of wounded-to-killed ratios (pages 181-205). Lethality in this case refers to people killed or died of wounds.
Again, I am not comfortable by what recent writers mean by their use of the word “lethality.”
Well, things in the Gulf have been quieter this last week. We ended up doing three posts related to the casualty estimates for a conflict in Iran. This was because part of President Trump’s decision making was based on an estimate of 150 killed if they struck Iran. This got my attention, because actually, hearing about casualty estimates before a conflict is kind of rare. We end up with three posts on the subject. The first post on subject speculated that President Trump was given a range of estimates, and that was probably the upper boundary of that range. The second post asked is that estimate was for killed or casualties? If is was killed, then were we looking at over 1,000 casualties from three air strikes? The third post noted that casualty estimates for “evaluating wars” is not that common. This lead me to guess that no such estimate has been made for an extended conflict with Iran. An extended conflict with Iran could move beyond the Gulf to Iraq, Syria and Afghanistan.
I do note that several of the talking heads on TV have mentioned that providing a casualty estimate is standard practice when briefing for a military action. This may be the case, I have never been to one of those briefings. But….while casualty estimates for a single proposed operation may be common, my experience is that they are not that common when it comes to evaluating wars.
There were certainly multiple estimates done in 1990 for the 1991 Gulf War both inside and outside the Government. A number of estimates were high and many have never been publicly released. I have yet to have seen any systematic analysis of the casualty estimates done for the Gulf War. Most of these were based upon combat models, so as such, serve as a validation test for these combat models. Wikipedia used to have a discussion on this issue, but it has since disappeared. Needless to say, the estimate derived from a combat model made before a war is probably something that would be very telling. The fact that DOD never conducted an analysis after the war of the various estimates is also very telling.
Now, we did do an estimate in fall of 1995 for a Bosnia peacekeeping operation (the Dayton conference ended with a peace agreement in November 1995). This was the only estimate done for this operation. According to rumor, the Joint Chiefs of Staff asked the Deputy Under Secretary of the Army for Operations Research (DUSA-OR) if they could do such an estimate, and were told that there was no methodology to estimate casualties in an Operation Other Than War (OOTW) (see page 309, America’s Modern Wars). So The Dupuy Institute ended up doing such an estimate, and we did it based upon two different methodologies (see Appendix II, America’s Modern Wars).
As far as I know, we were also the only people who did an estimate in 2004/2005 for the cost and duration of an extended guerilla war in Iraq. Some one else may have done some work on duration, as I kept hearing the statement made that guerilla wars lasted an average of ten years. I could never tell if that figure was pulled from our work or if someone else did some similar work. Regardless, I think we were the only people who did an analytically based casualty estimate of the war. See Chapter 1, America’s Modern Wars.
Now, when I was writing America’s Modern Wars, I decided to look into what estimates had been made in the first half of the 1960s for the war in Vietnam. I really could not find anything analytical, although my search was not exhaustive (meaning I am still waiting for someone to prove me wrong). But, it does not appear that any analytically based estimate was made during the 1960s for casualties and duration for what turned into America’s third bloodiest and second longest war. See pages 4, 29-30, America’s Modern Wars.
So, there appears to have been an estimate done for the casualties for a strike on Iraq (although I doubt it will be made public). On the other hand, it is doubtful if anyone has done an estimate for the full range of options, or addressing the Iranian counter-options, or examining an extended conflict with Iran. This would certainly have to address the range of counter-strikes and other options available to Iran if such a conflict further developed. For various reasons, the DOD seems hesitant to do these types of estimates.
Now, I happen to think our decision makers would be better served if they indeed did have some estimates of casualties and duration of these conflicts when they were contemplating their options. They were not done for the Vietnam War, only one estimate was done for Bosnia and I think only one estimate was done for the continuing war in Iraq. I am guessing, based upon that track record, no such estimate has been made for an extended conflict with Iran.
Sometimes in the discussion of casualties, people confuse the word “casualties” with killed. Casualties are all those people who are killed, wounded, missing or captured. It also sometimes includes Disease and Non-Battle Injuries (DNBI), or those injured or killed in accidents. For example, in the Mayaguez operation in 1975 there were 18 Marines killed in action, 3 Marines missing in action (and captured?) and 23 people killed in a helicopter accident before the invasion of Tang Island.
If you are doing a casualty estimate, it can either be based upon total killed (in combat or from all causes) and may include wounded. Depending on the combat situation and wounding agent, the number wounded is often between 3 to 10 per person killed (see War by Numbers, Chapter 15: Casualties). In the case of air to ground strikes, we would expect the wounded-to-killed ratio to be on the higher side. If there is good medical care, this also affects the wounded-to-killed ratio.
So, with President Trump mentioning an estimate of 150 killed, are we then looking at 600 to 1650 casualties (killed and wounded)? Were they really looking at over 1,000 casualties from the air strikes in three locales? That is hardly a “surgical air strike” to borrow a phrase from the Cuban Missile Crisis. It is possible that someone garbled the phrase killed and casualties. This has happened multiple times before.