Category Casualty estimation

We our down to our last 16 copies of Attrition

Just to give you all a heads-up, we are down to our last 16 copies of Attrition: Forecasting Battle Casualties and Equipment Losses in Modern War. Hard to predict how long those remaining copies will last. It is still affordable at $19.95. Right now, Amazon is selling it used for $50 – $400. See: TDI Books For Sale (dupuyinstitute.org).

I do not control the rights to reprint it.

Ordering info is here: TDI Purchasing Publications (dupuyinstitute.org)


The New York Times casualty reports

Turns out the New York Times, based upon citations of unnamed U.S. officials, is providing the following estimates of losses:

1. Russia: up to 120,000 killed and 170,000 to 180,000 wounded.
2. Ukraine: close to 70,000 killed with 100,000 to 120,000 wounded.

I have lots of heartburn with these figures.

First… wounded-to-killed ratios:

The wounded-to-killed ratio for WWII was 3:1. The wounded-to-killed ratio for Soviets troops at the Battle of Kursk (1943) was around 2.5:1 (2.48-to-1). Specifically, in the Voronezh Front from 4-11 July it was 2.29-to-1 and from 12-18 July 1943 it was 2.68-to-1. For the opposing Germans it was 5.11-to-1 and 4.54-to-1 respectively. See Kursk, page 1374 (not too many people can say “see page 1374 of my book”).

Since World War II, wounded-to-killed ratios have risen to 5-to-1 or higher. It was 10-to-1 for the U.S. Army in Afghanistan (and 13-to-1 for the USMC). The Donets People’s Republic (DPR) reported a wounded-to-killed ratio for 2022 of 4-to-1 (4.16-to-1).

So, they have for the Russians a wounded-to-killed of 1.5-to-1. Really? Read my book War by Numbers, Chapter 15, and then come back with some intellectually valid estimates. These are not!

They have the wounded-to-killed ratios for the Ukrainians at between 1.42 or 1.71 to one. Same ballpark as the Russians. Yet the Soviet Union has a wounded-to-killed ratio at Kursk in 1943 of 2.5-to-1. Are you saying that medical care and evacuation in the Russian and Ukrainian armies now are considerably worse that of the Soviet Union in 1943, when they did not have penicillin? The argument is absurd.

Second… Russian killed:

The only systematic reporting of Russian killed that I am aware is the BBC/Medizona reports by name of people killed. As of 11 August, this was a total of 30,003. These figures are gathered from a mix of obituaries, newspaper reports, formal death certificates, contacts with the families, reviewing graveyards and gravestones, and I gather a number of catch-as-catch-can methods. I have not reviewed their data collections efforts in detail. From my correspondence with them, they believe they are accounting for about half of the dead. This seems like a reasonable assumption, although it is an assumption. This would mean that total Russian dead from the war is perhaps 60,000 or more killed. Not sure how we get from there to 120,000.

Third… Ukrainian killed:

The reporting we have on Ukrainian dead is worse than what we have for Russian dead. Now, I am sure the Ukrainians have a better count, but they have not provided any reporting in a very long time (since summer of last year). My sense is that Ukrainian dead is probably less than Russian dead at this point. Maybe 75% of Russian dead, although this is a guesstimate based upon no solid data. So, their estimate of 70,000 Ukrainains versus 120,000 Russian dead sort of matches. It is 58% of the Russian dead or a casualty exchange ratio of 1.71-to-1. I really don’t buy into that. Ukrainian definitely took some casualties in the Kherson operations August-October 2022, possibly more than the Russians. They are on the offensive now against prepared positions. If they have significant artillery superior it is possible they could have a 2-to-1 exchange ratio, but Russia does have some active artillery, as the 47th Mech Bde videos in June showed. So, I do question the 1.71-to-1 exchange ratio.

So, if Russian killed are 60,000, then Ukrainian killed could be 45,000 or higher. I am still guessing that the wounded-to-killed ratio is 4-to-1 or higher. So maybe for Russian 60K killed and 240K wound for 300K casualties (which actually does match the totals in the New York Times article). For Ukraine maybe 45K killed (or more) and at least 180K wounded for a total of 225K casualties or higher.

Of course, these are estimates based upon little actual data. But, while it is hard to tell what the correct estimate is, it is pretty easy to tell if there is an issue with an estimate if they cannot provide a reasonable wounded-to-killed ratio. If they can’t provide a reasonable interpretation of that fairly well documented relationship (again see War by Numbers or Dupuy’s Attrition), then it does make one wonder what can be trusted in such an estimate.


P.S. If you take the estimate of 120K Russian killed and assume 4-to-1 wounded, then you end up with 600,000 casualties which is hard to explain in an army that has only deployed 300,000+ to Ukraine. It does appear that people keep dicking with the wounded-to-killed figures so they can report more killed without producing outrageously high total casualty figures. 

Russian Losses over Time

Russian deaths, according the BBC/Mediazona accounts, were 6,902 from 24 February through 21 September 2022. Russia itself reported on 21 September that there were 5,937 killed. Now, we suspect the Russian reports understate their losses and by the nature of the data collected, the Mediazona reports also certainly understate Russian losses. That their figures are close to each other is an interesting coincidence. It does make one wonder if the Mediazona weekly totals can be used to measure the intensity of combat and degree of losses over time.

Let us toy with that idea for a moment. On 9 November, General Milley stated that Russian casualties were  “…well over 100,000…”. Now “well over 100,000” could be 199,999, but I have assumed it meant in the low end of “well over 100,000.” He also noted at the time that “Same thing probably on the Ukrainian side.” See: 100,000 Russian troops killed or injured in Ukraine, US says – ABC News (go.com).  Currently, as of 17 March, the Ukrainian Secretary of the National Security and Defence Council is arguing that total Ukrainian losses are less than 100,000 killed and wounded.

Now, as of late March, the U.S. DOD is apparently claiming that Russian losses are around 220,000 casualties. Does this mean that they think Russians losses have doubled since 9 November?

Let is compare that to the Mediazona death data. Up to 21 September, Russian deaths are reported at 6,902. Going up to 9 November pushes the count of deaths up to 8,826. Reported Russian deaths by Mediazona for the period from 10 November through 8 March is 4,174. Therefore, the Mediazona count of deaths over time is more than twice as much up through the more than 8 1/2-month period up to 9 November than for the four-month period from 10 November to 8 March. Yet the U.S. estimate of Russian casualties appears to double their losses over this four-month period.

So….

1. Either the U.S. DOD back on 9 November meant that “well over 100,000” meant around 150,000 or more (and so to were Ukrainian losses), or….

2. The U.S. DOD actually believes that the intensity of combat and Russia losses has more than doubled during the last four months, or…

3. They have kind of garbled this up. In light of some of their last estimates, this cannot be ruled out.

By the way, U.S. DOD estimates are talking total casualties (which is killed, wounded and possibly missing). They don’t state this, but only about 20% -25% of those are killed (assuming a 4-to-1 wounded-to-killed ratio or a WWII-like 3-to-1 wounded-to-killed ratio).


P.S. The following blog posts are related to this discussion:

BBC/Mediazona Figures Over Time | Mystics & Statistics (dupuyinstitute.org)

Casualty Estimates for the Russo-Ukrainian War | Mystics & Statistics (dupuyinstitute.org)

Wounded-To-Killed Ratios | Mystics & Statistics (dupuyinstitute.org)

Wounded-to-killed ratios in Ukraine in 2022 | Mystics & Statistics (dupuyinstitute.org)


BBC/Mediazona Figures Over Time

BBC Russia, working with Mediazona, have since early in this conflict kept a count by name of the number people reported killed from multiple sources in Russia. Don’t know how accurate the list is, but I gather everyone they list did die in Ukraine. It may not have been a combat loss. They are also probably some who died in Ukraine who are not listed. Whether the number not listed is a significant additional amount is not known. Nor is it known if there are more people have died who are not listed then those who are listed. Not sure how I would estimate that. 

Still, it is the only listing of Russian dead over time other than the weekly DPR reports (which I may blog about later). 

Anyhow, there is a chart in this link of the people killed over time: Russia’s losses in the war with Ukraine. Summary of “Mediazona”

I have not figured out how to capture it and publish it directly to this blog, but the chart I am looking at is halfway down the page called “Losses of the Russian army in the weeks of the war.” It does give casualties for each week, but only counts a total of 13,019 deaths (out of 18,024 deaths as of 24 March). This is because in a large number of cases, the exact date of death is not known.

The first week of the war is 514 deaths. The second week is 574, the third week is 437. It then drops noticeably in the fourth week to 248, then up to 333, then down to 183. This brings us into early April (up to 6 April), when Russian had withdrawn from most of northern and northeastern Ukraine. It is a total of 2,289 deaths in the first six weeks of the war. Actual losses were probably higher.

On 2 March, Russia published a casualty report saying their losses were 498 troops killed and 1,587 wounded since 24 February. As can been seen from the Mediazona report, there were at least 514 deaths in the first week of the war. 

On 25 March Russia reported 1,351 killed and 3,825 wounded. BBC/Mediazona reported less at the time, with 557 confirmed deaths as of 21 March. From the current Mediazona chart, it appears the killed are 514 + 574 + 437 + 248 = 1,773.

The only other Russian report of losses was on 21 September, when they reported 5,937 killed. At that time BBC/Mediazona were reporting 6,476 killed as of 15 September from their counting efforts. Counting from this chart shows up through 21 September: 1,773 + 333 + 183 + 143 + 197 + 287 + 226 + 275 + 184 + 313 + 244 + 178 + 157 + 175 + 206 + 200 + 193 + 167 + 114 + 85 + 128 + 166 + 118 + 179 + 284 + 197 + 197 = 6,902.

Not sure what conclusions I should draw from this.

As can be seen by this chart, Russian losses were fairly high in September and October, running between 197 and 314 a week, and were again fairly high in December 2022 through early February 2023, running from 227 to 220 a week. They have since declined. 


Also see: Casualty Estimates for the Russo-Ukrainian War | Mystics & Statistics (dupuyinstitute.org)

Wounded-to-killed ratios in Chiraq

Probably going a little astray here but was looking at reports of the number of civilians killed and wounded in the gun violence in Chicago.

It is reported that in the last 30 days, 37 people were killed and 131 were wounded. This comes out to a wounded-to-killed ratio of 3.54-to-1 or a lethality figure of 0.22. This is kind of a high wounded-to-kill ratio for direct fire weapons.


Playing with the database (see: Chicago Crime, Murder & Mayhem | Criminal Infographics | HeyJackass! | Illustrating Chicago Values) show that in 2022 there were 665 shot and killed and 2937 shot and wounded for a wounded to killed ratio of 4.42 or lethality of 0.23.

For example, in War by Numbers, pages 184-187, I have various reports from WWII of lethality of rifles of 0.32, for infantry projections of 0.30, for gunshot of 0.39, for small arms of 0.34 or 0.38 included died of wounds, of small arms in Korea of 0.26, of small arms in Vietnam of 0.49 or 0.30 including carded-for-record, of “low-velocity bullets”: in Northern Ireland of 0.08, of “high-velocity bullets” in Northern Ireland of 0.37, of bullets in 1982 Israeli-Lebanon War of 0.31, of small arms in the 1982 Israeli-Lebanon War of 0.28. Weighing all ten data sets equal: let’s say: 0.314. This is a wounded-to-killed ratio of 3.18 as caused by small arms. 

Now, a civilian environment is different that a combat zone. To start with the mix of weapons used is different. Lots of pistols, Second, the people tend to receive medical attention quicker than on a battlefield. On the other hand, some people are shot multiple times on the street, and some shootings end with a “kill shot.” Still, the wounded to killed ratio is 3.54-to-1. Of course, not sure if all the wounded are counted either. Are the wounded who do not need hospital attention counted? Are some of the wounded who need hospital attention also not counted because they choose to avoid the hospital (and the authorities)?

Artillery (fragmentation wounds) tend to have a higher wounded-to-kill ratio that wounds from gunfire (for example 0.11, 0.19, 0.27 or 0.18, 0.22 or 0.26, 0.34, 0.14 or 0.07, 0.13, 0.11 and 0.21 for an average of 0.196 or a wounded-to-killed ratio of 5.11-to-1). In convention combat, artillery tends to be the cause of the majority of wounds.

I do not know the accuracy or providence of the data I am accessing. It is discussed on the website I am referencing (Chicago Crime 2022 Archives – Criminal Infographics – HeyJackass!). Does killed only include those who are dead when they have arrived in the hospital, or does that database include those who died after they arrived (including days or weeks after they arrived)?


Thanks to Abdulelah Almarri for pointing me to the Chiraq data.

Carded-for-Record in WWII

In our report: “C-1 Combat Mortality: Why is Marine Combat Mortality Less than That of the Army (JCS) (March 1998),” volume 2, Figure 145 is the following table. It was part of the presentation done by Col. (Dr.) Ron Bellamy. 

From Table 1, page 4, Medical Statistics in WWII, Office of the Surgeon General, US Army, 1975

                                            The Adjutant              The Surgeon

Type of Casualty                General’s Report       General’s Report

Wounded in Action            592,170                       723,560

    Carded for record only           —                        123,836

    Wounded admissions             —                        599,724

Total Deaths                        216,005                      213,030

    Killed in action                189,696                      192,220

    Died of wounds                 26,309                        20,810

    Other battle deaths           18,869                        16,793

Total killed and wounded   808,175                      936,590

Ratio, Wounded/Deaths           2.74                            3.40

Percent Deaths                         0.27                            0.23


If I calculate the wounded-to-killed ratios based upon KIA + DOW/WIA (wounded admissions) it comes out to 2.74 (as shown above) and 2.82-to-1 (vice 3.40).

Anyhow, the carded for record discussion for Vietnam is a little more complex. Maybe later.

Return-to-Duty (RTDs)

I have never really done any work on RTDs. I have an entire chapter on Casualties (Chapter 15) in War by Numbers, but nothing really on RTDS.

Anyhow, more than one person has asked me about this, so let me outline what I/we know:

1). The rule of thumb Trevor Dupuy developed on RTDs was in his “Handbook on Ground Forces Attrition in Modern Warfare,” September 1986, page 90. It says:

“Finally, there is a general rule of thumb for estimating returns to duty from casualties. For each 100 personnel casualties (battle casualty, disease, or injury) 75 will be returned to duty at the end of 20 days at a rate of five per day between the 6th and 20th days after admission, and 25 will never be returned to duty as a result of death, evacuation to the Zone of the Interior, or discharge. This will vary widely from situation to situation, depending in large part upon the theater evacuation policy.”

It is also in his book Attrition, pages 53-54, stated the exact same way. We still have copies of Attrition for sale: TDI Books For Sale (dupuyinstitute.org).
 

2). A report done by several people, including Ron Bellamy, who I have worked with, provides the following table:

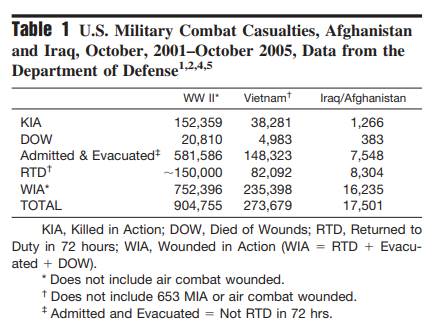
This chart is from this report: ADA480496.pdf (dtic.mil). I am indebted to Alex Roslin for this research.

Note that RTDs here is those that are returned within 72 hours. So, 752,396 WIA in WWII. Of those, 20% are RTD within 72 hours (and 2.8% are DOW). For Vietnam 235,398 WIA. Of those, 35% are RTD within 72 hours (and 2.1% are DOW). Note that these RTDs within 72 hours are probably all casualties “carded for record only.”

Note that the wounded-to-killed ratio for the WWII data is 4.94-to-1 or 4.22-to-1 if DOW is counted as KIA vice WIA and 3.36-to-1 if DOW is counted as KIA and RTD is not counted as WIA. The wounded-to-killed ratio for Vietnam data is 6.15-to-1 or 5.33-to-1 if DOW is counted as KIA vice WIA or 3.43-to-1 is RTD is not counted.

For the Iraq/Afghanistan data there are 16,235 WIA. Of those, 51% were RTD within 72 hours (and 2.4% are DOW).The wounded-to-killed ratio is 12.82-to-1 or 9.61-to-1 if DOW is counted at KIA vice WIA and 4.58-to-1 is RTD is not counted.

Now, I suspect some of the figures are skewed by how casualties are counted. In World War I and II, you were counted as wounded if you spent the night in a hospital. In Vietnam at one point the U.S. Army counted 96,900 wounded and maybe 104,000 carded-for-record only, meaning over 100,000 soldiers were not counted as wounded, but were allowed to receive the Purple Heart (my father got one that way). I may need to do a blog post about “carded for record” or WIANE (wounded-in-action, not evacuated).

See our report: “C-1 Combat Mortality: Why is Marine Combat Mortality Less than That of the Army (JCS) (March 1998),” page 19. This was done as a joint project with Ron Bellamy. 

3). Now, where the “rule of thumb” that Trevor Dupuy came from is not known. In an attempt to find them, I pulled up three of the old HERO reports 1) 14. Historical Analysis of Wartime Replacement Requirements (26 July 1966), 2) 48. German and Soviet Replacement Systems in World War II (July 1975), and 3) 86. Analytic Survey of Personnel Replacement Systems in Modern War (Apil 1981).

In the second report, page 24 they do have a table “Table 3. German Replacement Army Strength, NCOs and Men, 1 September 1944” which has a total of 2,137,973 with “convalescents” making up 178.456 of that replacement army strength (8%). On 4 December 1944 (page 45) they show for November 1944 342,000 replacements of which 40,000 are convalescents (12%). And then on page 54 there are four tables, three which show convalescents. The most interesting is “Table 20: Losses and Arrivals, German Field Army. From July 1943 to March 1944.” It shows arrivals by month to the Eastern Front as 930,000, of which 421,000 are convalescents, 478,500 are replacements and 30,500 are FTDs (recruits sent to Feild Training Divisions). For “Other Fronts,” the numbers are much smaller: 24,000 convalescents and 50,000 replacements. What is interesting, but not surprising, is that the number of convalescents increase over time. From July through October 1943 it is 34,000 to 46,000 convalescents for each month, by February and March 1944 it is 60,000 convalescents a month. 

For the Russians (page 90), the Germans estimated that 200,000 Russian convalescents were returned monthly to combat as replacements. The Germans estimated (page 91) that in 1942 ten Soviets armies received 764,000 replacements. Of them, new conscripts formed 56.5% of the total, 22.5% were convalescents, 10% were from labor battalions, 9.5% had been non-combat troops, and 1.5% had formerly had occupational deferments. Over 44,000, about 6%, were former convicts, released from prions and concentration camps. 

For 1 January-31 August 1943 for sixteen Soviet armies the Germans estimated that 89% of the replacements were new conscripts, 9% were convalescents, and 2% were former non-combat and survivors of units destroyed. Also of interest is that the Germans estimated that 28% had training of less than 10 days, 49.6% had training of up to one month, and 22.4% had training of over one month. I will avoid the temptation to equate this with the current war in Ukraine.

A third report indicates that in June 1943, 34,384 Soviet replacements reached units (probably the Bryansk Army Group) facing the German Ninth Army as follows: 82% were new conscripts, 7% were convalescents, 11% were former non-combat. Their training was reported as 26% less than 10 days, 49% up to one month, and 11% were former non-combat.  

Now, none of this actually answers my questions on RTD rates, but I still found it pretty damn interesting.

Finally, there is the report “Analytic Survey of Personnel Replacement Systems in Modern War.” This last report was primarily written by C. Curtiss Johnson (in case he is reading this blog). 

It provides a few snippets of useful data. For example (page 48), it states for the 6695 and 6706 Conditional Companies (U.S. Army, Italy) that between 1 July 1944 and 10 June 1945 the two companies process approximately 12,400 patients, of whom nearly 10,400 were rehabilitated sufficiently to return to unit. This is 84% returned-to-duty.

In the case of the Vietnam War, the 90th Replacement battalion from the quarter ending 31 Jan 1969 through 31 October, processed 172,585 replacements and 175,346 returnees. Not sure this tells us much.

 But this does… to quote (starting from page C-2):

Table 20, based on data compile by the Office of the Surgeon, MTOUSA, in December 1944, shows… the sample included 71,378 patients, 29,727 of whom had been injured and 41,651 of whom were battle casualties. Of the injured patients, 26,174 or 88.05% were returned to duty after hospitalization, 799 or 2,69% died, and 2,754 or 9.26% were evacuated to ZI hospitals. Of battle casualty patients (WIA), 29,860 or 71.69% were returned to duty, 1,130 or 2.71% died, and 10,661 or 25.60% were evacuate to ZI hospitals.

Experience during 1943-1944 showed that 86.69% of injury patients who were returned to duty became General Assignment personnel, and the remainder (13.31%) became Limited Assignment. The same figures for battle casualty patients were 83.89% General Assignment personnel and 16.11% Limited Assignment personnel.  

…The General Board, ETO,… finding may be expressed in tabular form as follows:

Percentage of Returns Correlated to Theater Evacuation Policy

Days after Admission     Battle Casualties (2,090)   Non-Battle Cas. (100,000)

  60                                    50.7                                        90.6

  90                                    59.5                                        93.0

120                                    64.8                                        93.4

Of the total returned to duty, 28.6% of the battle casualties and 5.3% of the non-battle casualties were estimated to be Limited Assignment personnel. While no comparison can be made between the injuries surveyed by the Office of the Surgeon, MTOUSA, and the non-battle casualties surveyed by the General Board, ETO, the data for battle casualties in the two reports can be compared. This comparison shows that the MTO return rate (71.69%) much exceeded the greatest rate reported for the ETO (64.8%) and that the percentage of returned who became Limited Duty personnel was greater for the ETO (28.6%) than for the MTO (16.11%). The probable explanation for the disparity in these rates was the size of the populations surveyed: the ETO battle casualty sample was 2,090; the MTO sample was 41,651.

The Report of the Army’s postwar Replacement Board provides qualitative and quantitative assessments of the replacement value of hospitalized casualties. In Volume V, Annex 14, p. 1, Major General Russell B. Reynolds, who was ACS, G-1, SPA, stresses the replacement value of hospital returnees and comments:

When you sustain 10 battle casualties, you’ll bury 3, evacuate 2 to the US, find 4 suitable for return to duty in branch, and have to retrain, either in a training center, or on the job, 1. In the case of non-battle casualties, for each 10 you’ll evacuate about 4/10 of a man, bury 1/10 of a man, and find 8 2/4 suitable for return to duty in branch, and face a retraining job on 3/4 of a man. 

These numbers may be expressed on a percent basis as follows: of surviving battle casualties, 28.6% will be evacuees and 71.4% will be returnees; of surviving non-battle casualties, 4.0% will be evacuees and 96% will be returnees. It is interesting to note that when these figures are compared to the same figures derived from MTO and ETO data, there is a remarkable degree of correlation. 

The World War II data presented above may be compared to data developed from the statistical records of World War I by Colonel Albert G. Love of the US Army’s Medical Corps in 1931. Love found that in any typical group of AEF disease and non-battle injury (DNBI) patients, 3.70% would die, 7.52% would have to be evacuated (total lost 11.22%), and 88.78% would be returned to duty. For AEF battle casualty patients, excluding gas wounds, 8.12% would die, 29.58% would have to be evacuated (total lost 37.70%), and 61.88% would be returned to duty. The return rates for World War I DNBI casualties are very close to those of World War II, while World War I BC return rate is smaller than the smallest World War II BC return rate (ETO, General Board: 64.8%). The small World War I BC return rate undoubtedly reflects the less advanced medical treatment available in the earlier conflict (notice, for example, the greater percentage of BC patients dying in hospital).

Expressed in terms of AEF theater evacuation policies, Love’s data reveals the following:

Percentage of Returns Correlated to Theater Evacuation Policy

                                               Percentage Returned to Duty

Days after Admission          Battle Casualties        DNBI

  30                                        24.88                            67.40

  60                                        46.17                            81.74

  90                                        55.73                            86.38

120                                        59.53                            87.95   

…The best, most recent set of data on the replacement value of hospitalized personnel is the data developed from the Korean conflict by Frank A. Reister… Reister’s Table 13, p. 14, shows the final disposition of 248,946 US Army patients from division units originating in Korea during July 1950 – July 1953. Of this number 72,961 were battle casualties (WIA) and 175,985 were non-battle casualties. The distribution of final disposition for battle casualties originating in division units was as follows: 2.2% (1,574) died of wounds, 87.9% (64,159) returned to duty, 8.5% (6,239) were separated for disability, and 1.4% (989) wee administrative separations. The distribution of final dispositions for division non-battle casualties was as follows: 0.3% (485) died, 98.6% (173,525) returned to duty, 0.9% (1,625) were separated for disability, and 0.2% (35) were administrative separations.  

The return to duty figures developed by Reister may be compared to the same figures from Love’s compilation and the various World War II sets to indicate the relative increase in percentage of returns in the two admission categories since World War I and to underscore the value of hospital returnees as a source of replacements in future wars.

Bolding is mine. I suspect the bolded sentence was the basis of the Trevor Dupuy rule of thumb on RTDs.

In the end, there are over 140 old HERO, TNDA, DMSI and Trevor Dupuy reports. None that I have looked at clearly show where his “rule of thumb” on RTDs comes from, although it appears to have come from the last report referenced. I do have more old Dupuy files than I have time to look through them. 

4) There is probably more material out there of value. If so, please post it to the comments in this blog.

5) Proselytizing note: I really did try a couple of years ago to get a probably study done on wounded-to-killed ratios and weapon lethality over time. Could never quite get the funding. Not sure why. See: Two proposals on Combat Casualties | Mystics & Statistics (dupuyinstitute.org)

If someone really wants the answers to these types of questions, then someone needs to start funding proper research.

Latest Russian Losses

With estimates of Russian losses soaring, been poking about trying the figure out how bad it really is.

One interesting article is here: A Russian prisoner-turned-soldier says he was brought to the front line without training and told to charge ‘as far as we could go’ into Ukrainian gunfire (msn.com)

It details Wagner losses in three separate accounts.

1. Five men went forward, three were killed and two captured.

2. “half the soldiers in these assaults are wounded or killed, one soldier told the Times.”

3. “By other estimates, about 70% of soldiers are wounded or killed in battalions with former convicts, military analysts told the Times.”

They also state that the White House said that the Wagner Group had about 40,000 convicts deployed to Ukraine: “We continue to assess that Wagner currently has approximately 50,000 personnel deployed to Ukraine, including 10,000 contractors and 40,000 convicts.”

So, an attack by Wagner convicts results in 50% to 70% casualties. Not sure what the wounded-to-killed rate is for penal battalion attacks, but it might be lower than the norm of 5-to-1 or 6-to-1 for normal conventional warfare attacks (see: War by Numbers). Lets say 3-to-1 for the moment. How many of the 40,000 convicts have been sent in these “soak-off” attacks? Might be hundreds, might be thousands, doubt if it is tens of thousands. Lets say if 10,000 convict soldiers had been thrown away in this manner. We are looking at 10K x .50 (this assumes only one such attack) x .25 (wounded-to-killed ratio of 3-to-1) = 1,250 killed. Now this is a horrendous number, but certainly not high enough to justify all the much higher claims being made.

Then there are the attacks around Vuhledar. Clearly they took some losses, at least 16 AFVs from the hap-hazard counting I did and other claims are stating 31 tanks. This article states 130 peices of equipment, including 36 tanks and 5,000 soldiers killed, wounded or imprisoned: https://www.msn.com/en-us/news/world/russia-loses-entire-elite-brigade-after-5-000-troops-are-wiped-out-in-battle/ar-AA17tIWW?ocid=msedgntp&cvid=39ac09a80e3f4dde94b4b9904b629b67. These are, of course, Ukrainian claims. It would give them more credence if they reported the number captured and provided an actual body count figure. While body counts are in somewhat disrepute because of the U.S. Vietnam experience, I can only imagine that casualty estimates of enemy losses without body counts would only be much worse (more inflated). Still, with an estimate of 5,000 casualties, I am guessing that means less than 1,000 killed.

There are other attacks going on elsewhere along the front, but Vuhledar and Bakhmut (the Wagner area) are the two biggest ones. Not sure how this adds up to the UK estimate of 824 Russian troops being killed each day. It could certainly have happened in either locale for one day, but not sure how this turns into a norm day-by-day. Probably not the norm week-after-week.

Now, I am asking “What is the factual basis for these recent higher casualty estimates.” No one has actually answered that question. So in light of the non-response, this is my attempt to find the accounts that justify these higher estimates. They don’t really do that, especially day-by-day and week-after-week. A couple of good stories about high enemy losses does not establish the norm. The question is what is the factual basis for declaring such norms as 824 Russian troops killed each day? Are people taking exceptional incidents and using that to claim it is the norm?


Also see:

Wounded-to-killed ratios in Ukraine in 2022 | Mystics & Statistics (dupuyinstitute.org)

The Ukrainian casualty claims are inflated – part 1 | Mystics & Statistics (dupuyinstitute.org)

Wounded-To-Killed Ratios | Mystics & Statistics (dupuyinstitute.org)

Mediazona Counts vs Russian Federation Reports

The Russian Federation has only provided two casualty reports for this war. one on 25 March and one on 21 September 2022. Mediazona/BBC News Russia has been providing periodic updates since the war began. Let’s compare them for a moment:

25 March 2022 (Russia) 1,351 killed and 3,825 wounded (2.83-to-1 wounded-to-killed ratio)

vs

21 March (BBC News): 557 killed


21 September (Russia); 5,937 killed

vs

15 September (BBC Russia): 6,476 killed


As of 9 December, Mediazona is reporting 10,002 killed.

As of 3 February 2023, Mediazona is reporting 13,030 killed.

Mediazona Counts

While pursuing Mediazona counts of Russian war dead, I discovered that I am quoted in a number of recent articles. This includes:

25 Jan: What’s the truth about casualty numbers in Ukraine? – The Post (unherd.com)

1 Feb: Ukraine war: casualty counts from either side can be potent weapons and shouldn’t always be believed (yahoo.com)

2 Feb: Ukraine war: Casualty counts from either side can be potent weapons and shouldn’t always be believed (phys.org)

2 Feb: Ukraine: casualty count lies as a fog of war – Asia Times

I did exchange emails with James Billot on 23 Jan (see first article).

Getting back to Mediazona, their count as of 9 December was 10,002 Russian service members killed. See: BBC and Mediazona confirm 10,000 Russian soldiers dead in Ukraine — Meduza

To quote from that article: “BBC notes that, by the most conservative estimates, the real number of Russian soldiers killed in Ukraine may exceed 20,000, and the total number of irretrievable losses could be as high as 90,000.” 

Not sure of the basis for the irretrievable loss estimate. Seems very high. More than most estimates of total wounded if there were 20,000 killed. 

Mediazona‘s count of Russian service members killed as of 3 February was 13,030. See: A quarter of the dead are yesterday’s civilians: what is known about Russia’s losses in Ukraine by February – BBC News Russian service

The article also states:

“Consequently, according to the most conservative estimate, during the invasion of Ukraine, Russia could lose more than 26 thousand people dead.”

“Russia’s total irretrievable losses (i.e., the number of those out of action due to injury, death or missing) could be at least 117,000.”

“This figure is based on the observations of the Center for Naval Analysis of the United States, according to which for every dead Russian soldier during the war in Ukraine, there are an average of about three and a half wounded.”

Not sure of the basis for the 3.5-to-1 wounded-to-killed ratio. 

Anyhow, 26K x 5 (as I favor a four-to-one wounded to killed ratio) = 130,000 casualties (killed and wounded).

This is assuming that actual Russian killed are twice what Mediazona is counting, which appears to be what they are assuming.