I may continue updating this post for a while. This basically addresses the question of when is the virus mitigated, or even better when it is contained, and eventually when should restrictions be relaxed. So we look at South Korea compared to the three worst plagued countries in the world. We then look at three other countries in East Asia that were near China and had to deal with the virus sooner than most. We then look at a few other countries that appear to getting the virus under control. I think there is considerable value here in comparing results across several countries. All these are simple graphs pulled from the Johns Hopkins CSSE website as of 8:31:22 AM: Johns Hopkins CSSE
Here is the graph for the number of cases in South Korea (10,702 reported cases, only 89 more case than reported around this same time last week):
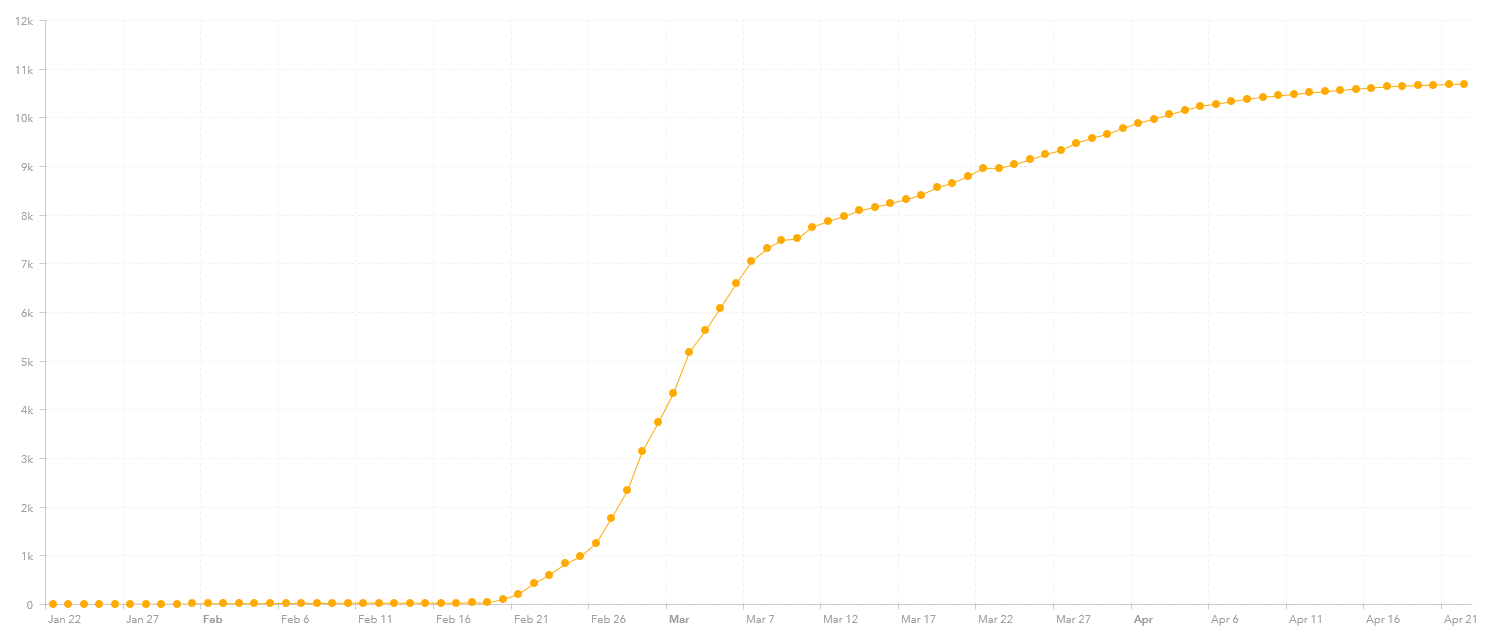
This is good. This looks like a country that now has the situation under control. Note how long it took (time is on the x-axis).
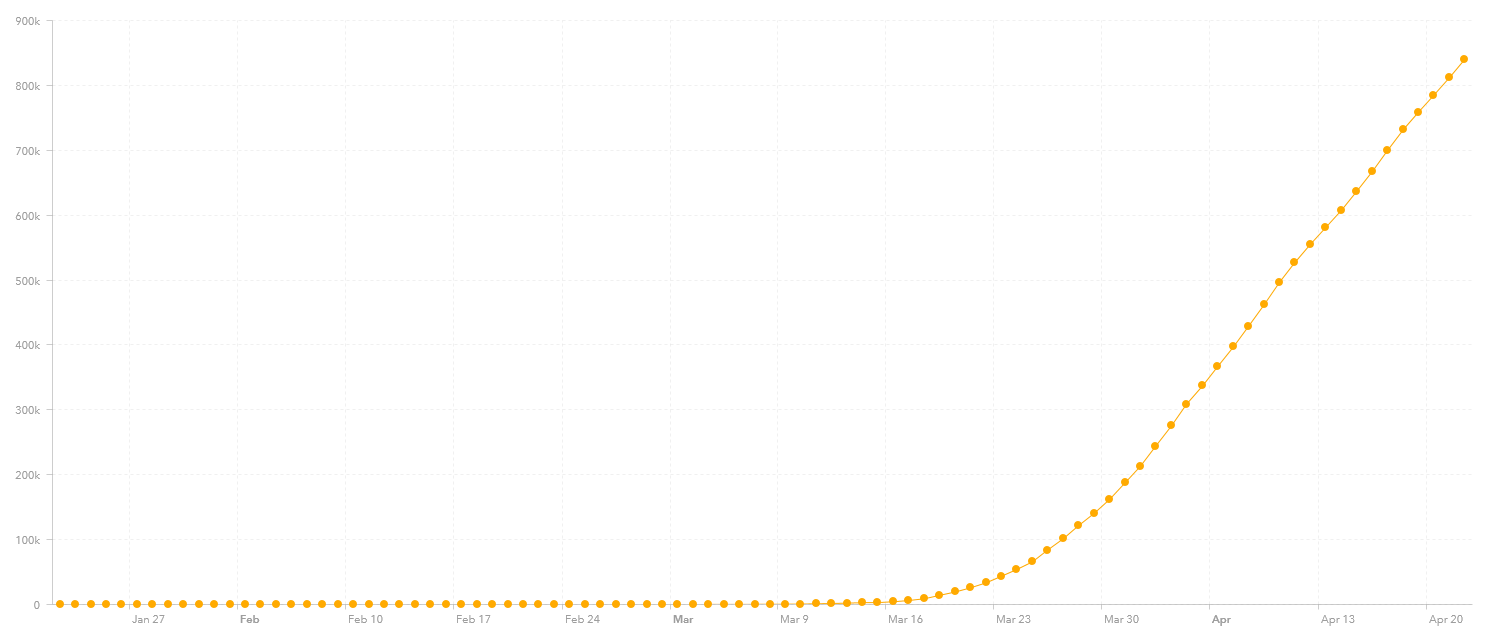
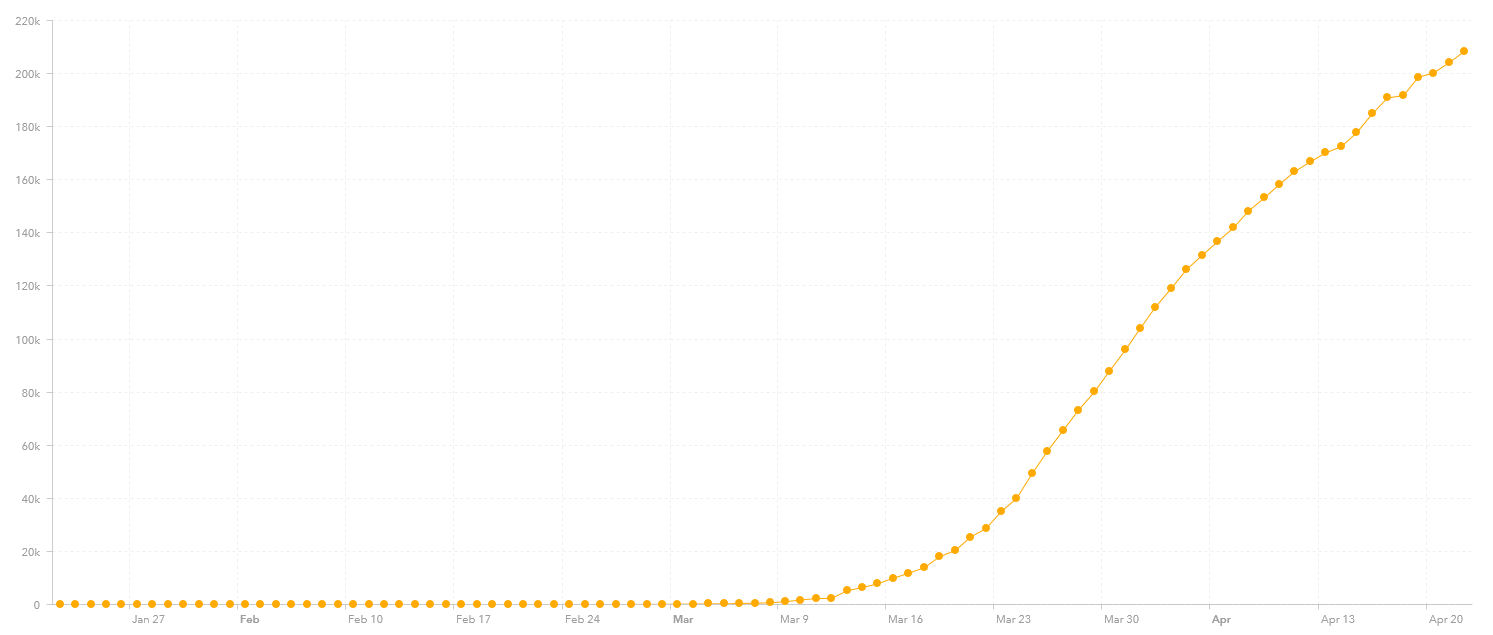
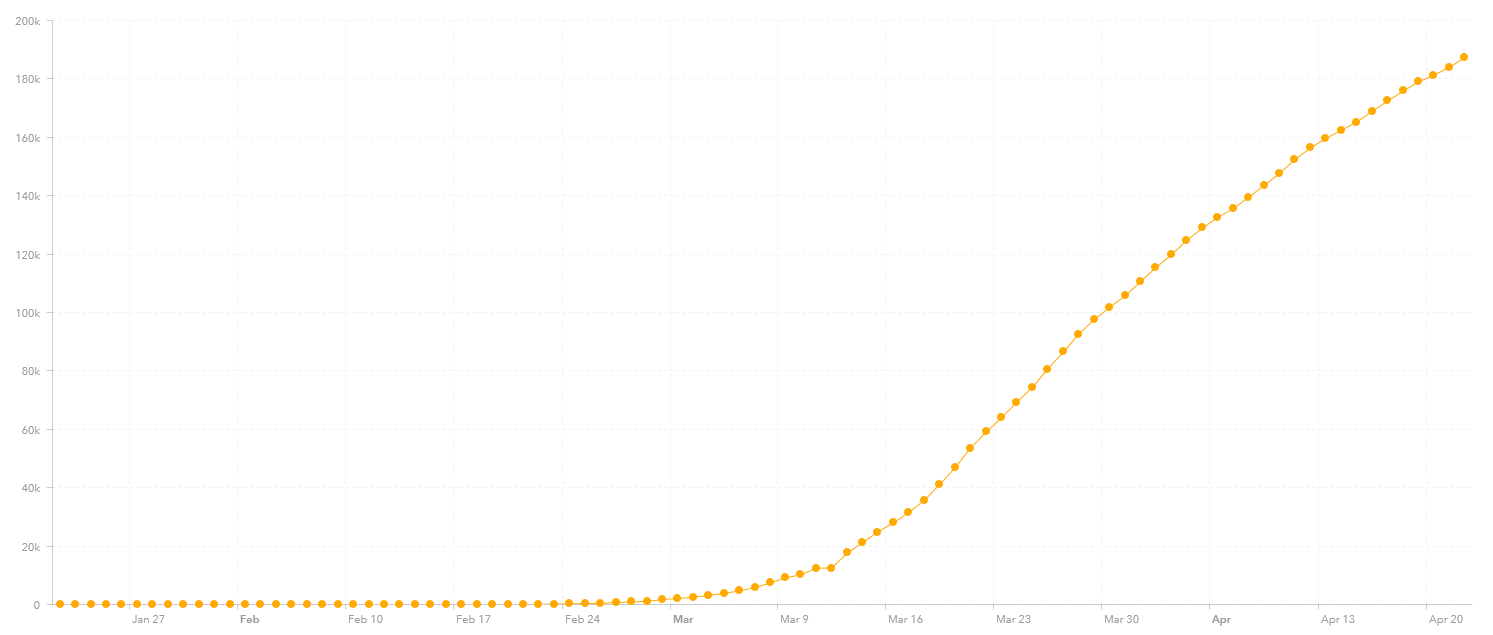
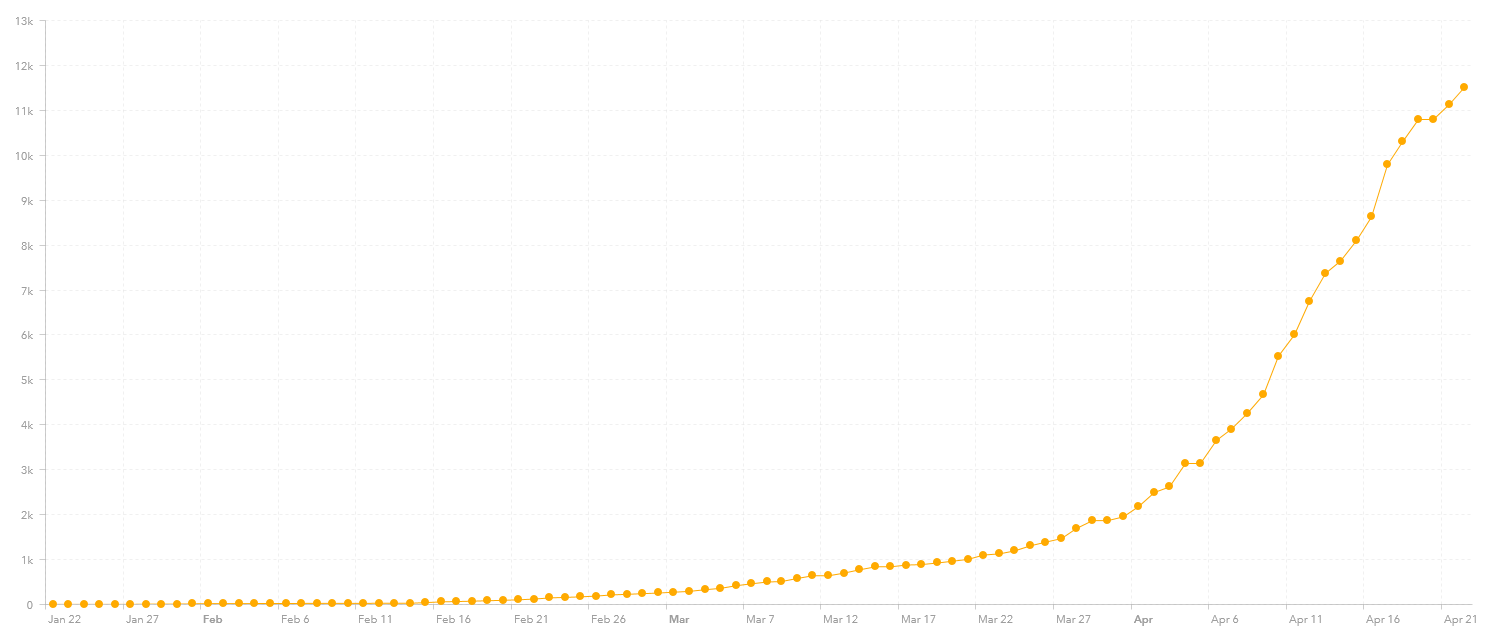
In comparison, here are the graphs for the United States (842,624 reported cases), Spain (213,024 reported cases) and Italy (187,327 reported cases). It looks like Spain and Italy are reaching their deflection point:
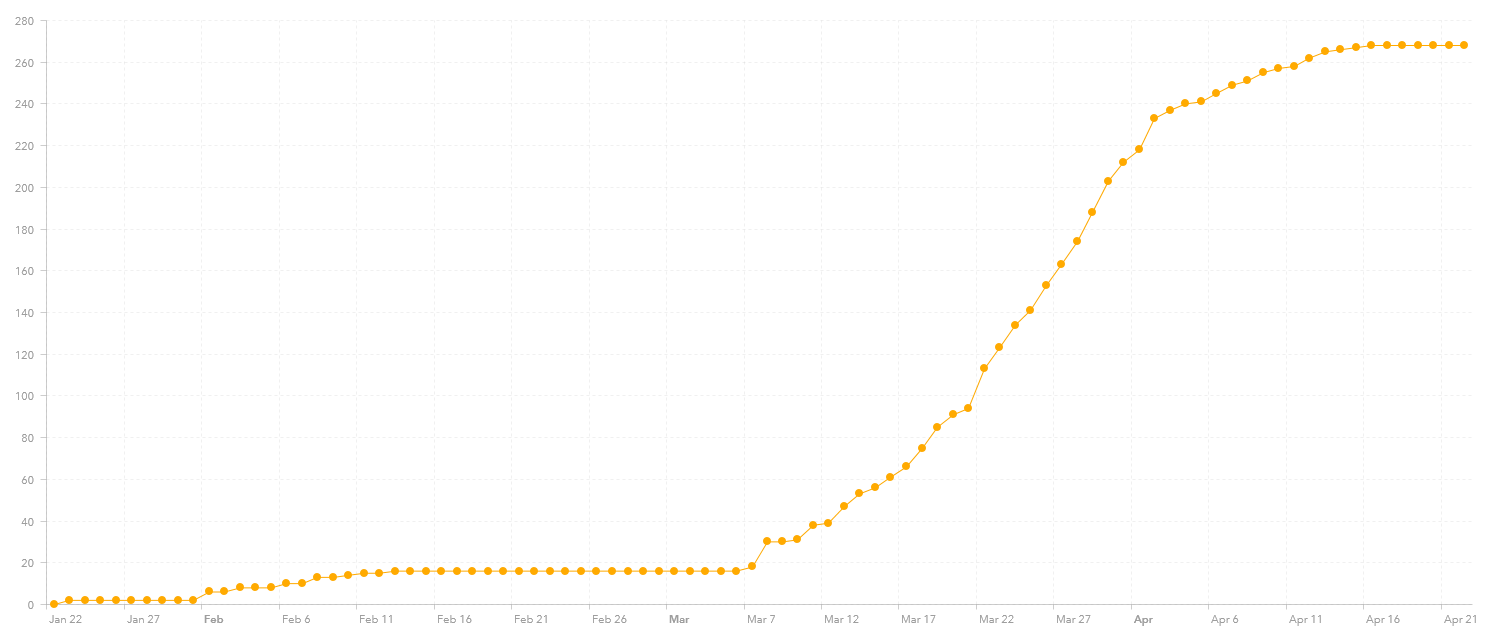
In contrast here are the graphs for three other East Asian nations, Japan (11,950 cases), Taiwan (427 cases) and Vietnam (268 cases, the same as last week). Not sure why Japan does not have the virus under control like South Korea does. This would be worth looking into.

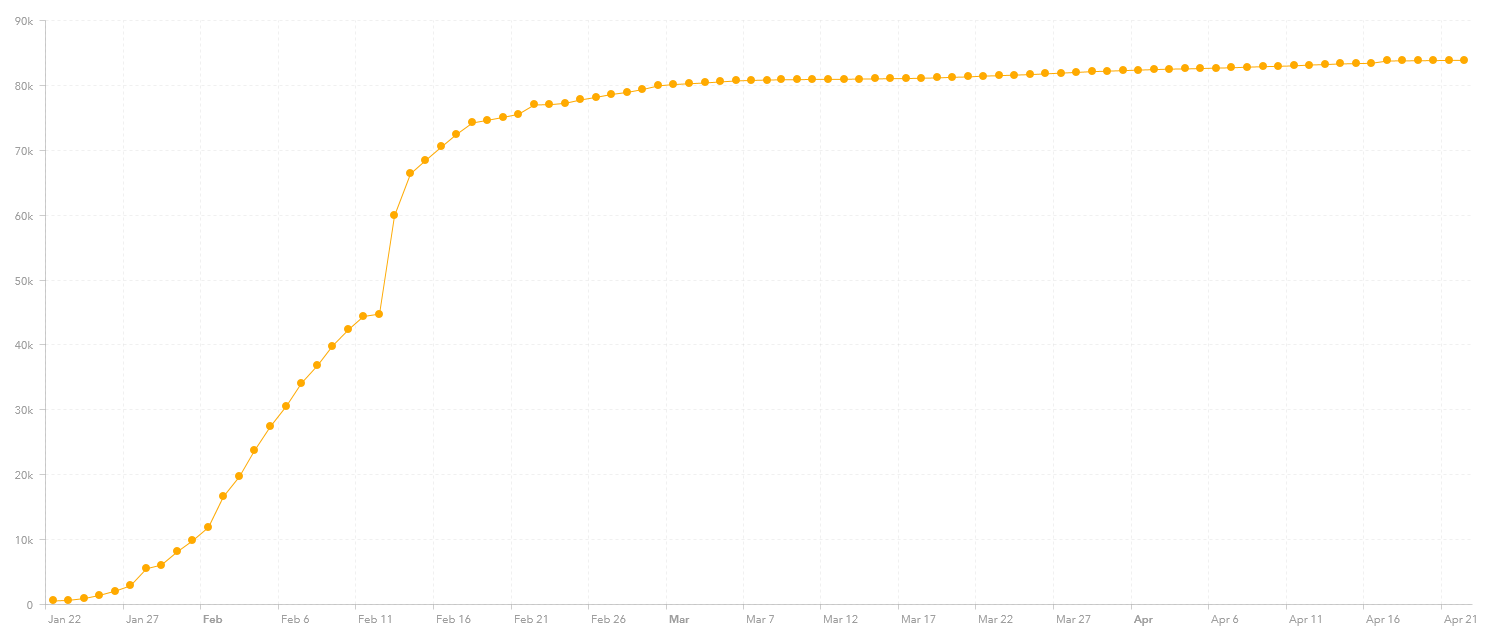
And here is China (83,878 reported cases), although there is still some concern about the accuracy of their statistics:
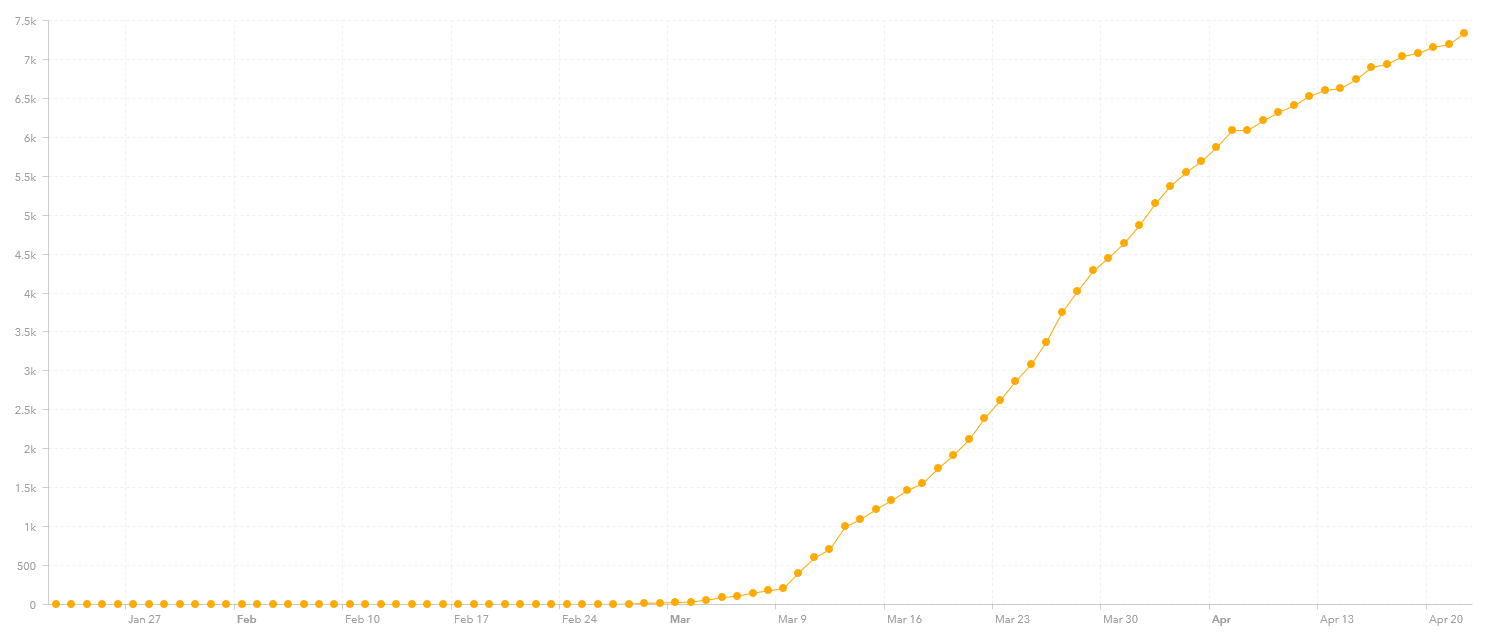
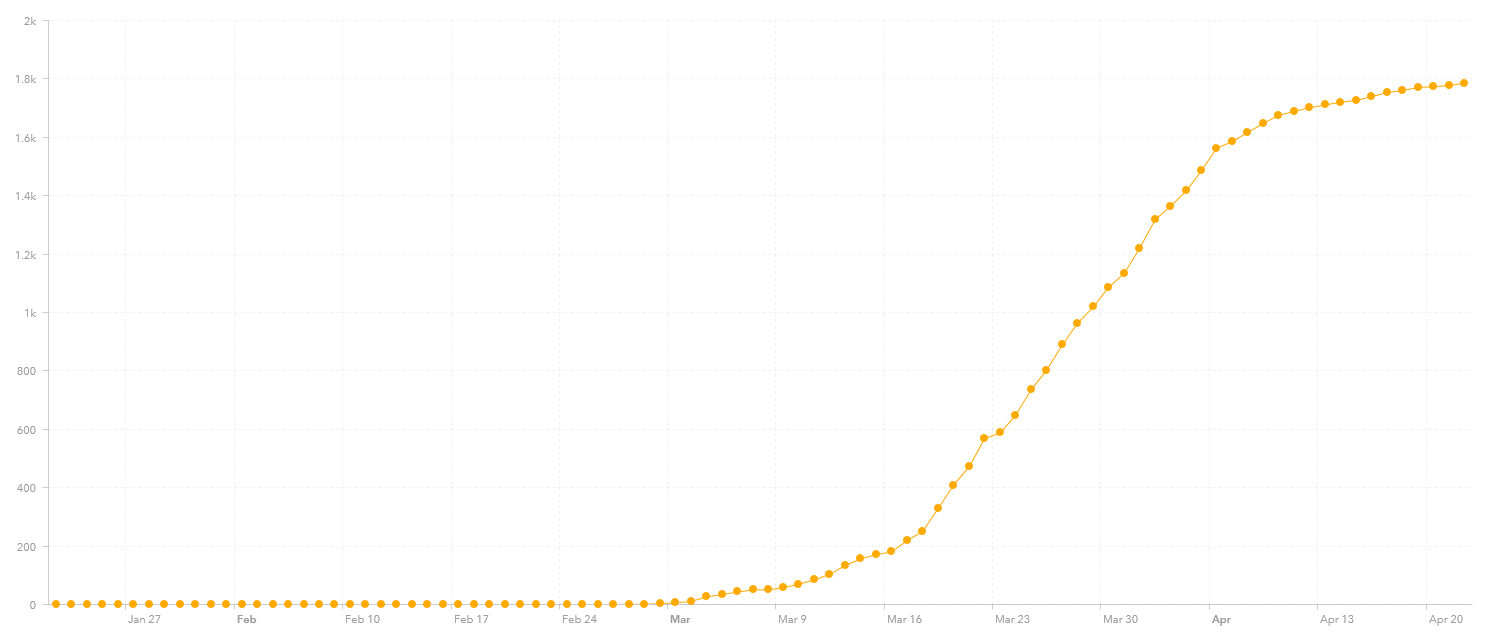
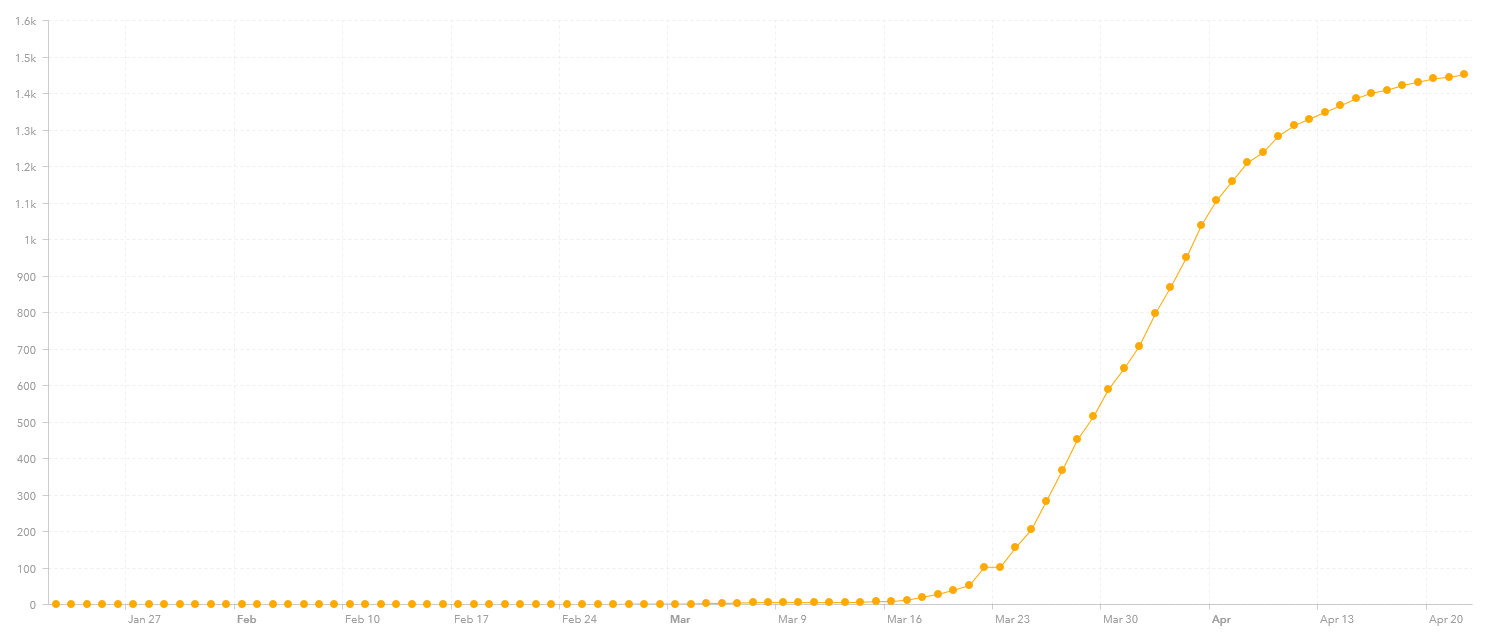
Finally, let me add the Austria (15,002 reported cases), Norway (7,338 reported cases), Australia (6,547 reported cases and only 85 new cases since last week), the Czech Republic (7,136 reported cases), Iceland (1,785 reported cases and only 58 new cases since last week) and New Zealand (1,451 reported cases and only 50 new cases since last week) to this collection of graphs as it appears that they are now reaching their inflection point and some have started leveling off:
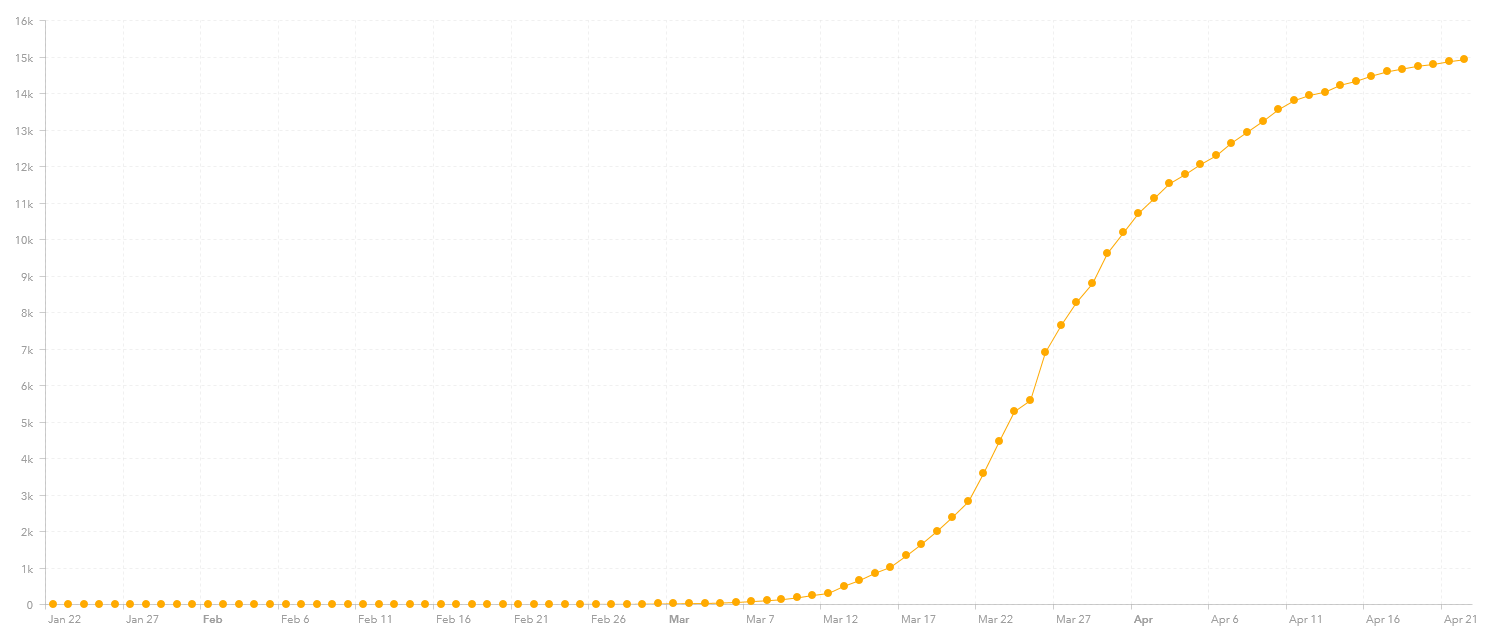


Finally, there is Germany, which has the fifth highest number of reported cases (at 150,773). They also appear to be bringing this under control.

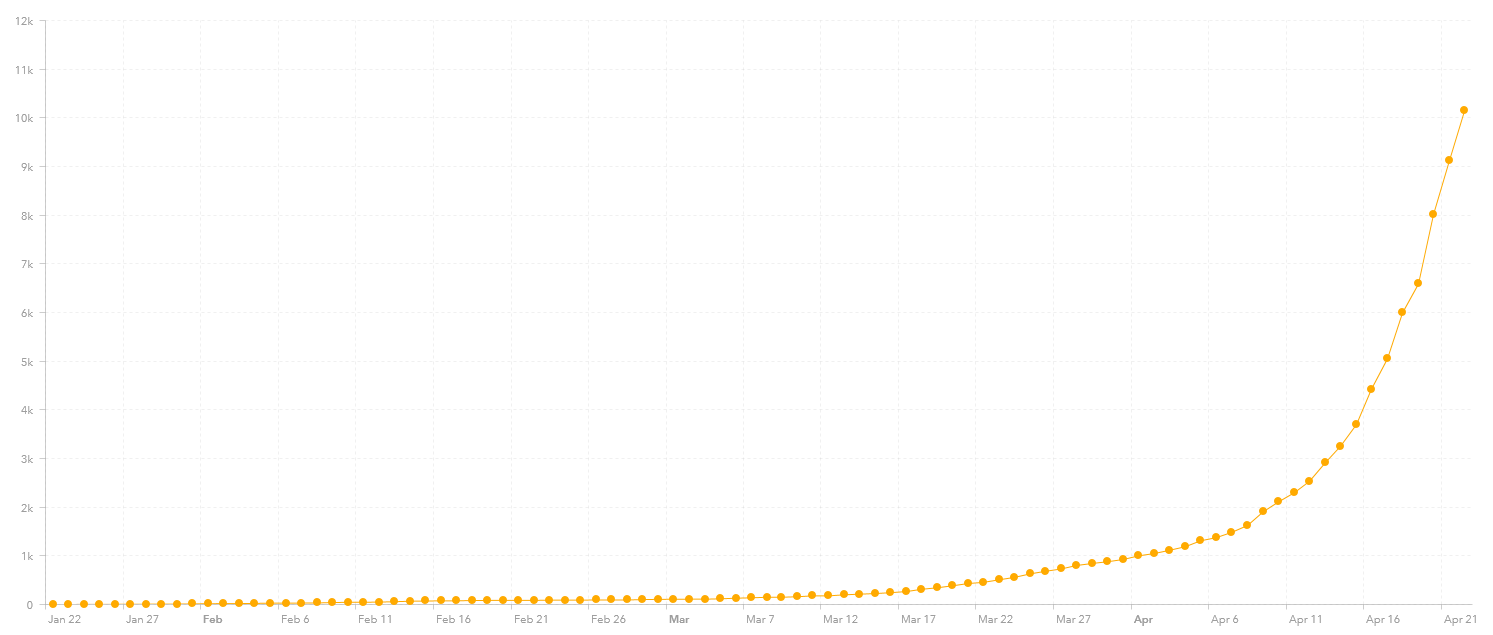
And then there is Singapore. Last week it had 3,614 reported cases. Now it has 11,178 reported cases. It appears that they have lost control of the situation again.

I’m very suspicious about those official coranavirus death tolls and looking forward seeing official confirmed figures of excess deaths from March to April from several countries. When i red article from New York Times i checked official coronavirus related death figures of some nations and compared excess deaths of these nations and found wider gaps than NYT.
Spain (9 March- 5 April): excess deaths 19700, official 12401= +7300
UK (7 March – 21 April) excess deaths 41100, official 17331 = + 23770
France (9 March – 5 April): excess deaths 13100, official 8059= + 5041
Holland (9 March – 5 April) excess deaths 4000, official 1766 = + 2234
Belgium (9 March- 5 April) excess deaths 2300, official 1447 = + 853
Sweden (9 March – 12 April) excess deaths 1100, official 899 = +201
Switzerland (9March- 5 April) excess deaths 1000, official 715 = +285
Ecuador (March – 15 April) excess deaths 7600, official 503 = +7097
NY City (11 March-18 April) excess d 17200, official 13240 = +4000
Jakarta (March) : excess deaths 1000, official 84 = + 916
(NYT made some mistakes of reported COVID-19 deaths when it comes countries like Sweden, Belgium, UK and Switzerland… real numbers were lower making gap even more wider to excess deaths)
Comparing official coronavirus deaths to those of excess deaths we will found same degree as with Bergamo province where excess deaths until March 26 was 4500 (5400 vs 900) while official coronavirus death toll of province “only” 2060. In fact official coronavirus deaths in Bergamo province, Netherlands and UK were just 42-44% of their excess deaths.
Though certainly not all excess deaths were coronavirus deaths directly we can claim that almost all were either directly or indirectly as result of pandemic. Besides – there are some reasons to estimate that excess death figures should be higher when e.g traffic accidents have sharply declined and there are more police forces controlling streets of urban areas.
Thank you. I appreciate this comment. Many of the stats are somewhat “fuzzy” with the Coronavirus, and some may be beyond “fuzzy.”