[The article below is reprinted from December 1996 edition of The International TNDM Newsletter. It was referenced in the recent series of posts addressing the battalion-level validation of Trevor Dupuy’s Tactical Numerical Deterministic Model (TNDM).]
How Attrition is Calculated in the QJM vs the TNDM
by Christopher A. Lawrence
There are two different attrition calculations in the Quantified Judgement Model (QJM), one for post-1900 battles and one for pre-1900 battles. For post-1900 battles, the QJM methodology detailed in Trevor Dupuy’s Numbers, Predictions and War: Using History to Evaluate Combat Factors and Predict the Outcome of Battles (Indianapolis; New York: The Bobbs-Merrill Co., 1979) was basically:
(Standard rate in percent*) x (factor based on force size) x (factor based upon mission) x (opposition factor based on force ratios) x (day/night) x (special conditions**) = percent losses.
* Different for attacker (2.8%) and defender (1.5%)
** WWI and certain forces in WWII and Korea
For the attacker the highest this percent can be in one day is 13.44% not counting the special conditions, and the highest it can be for the defender is 5.76%.
The current Tactical Numerical Deterministic Model (TNDM) methodology is:
(Standard personnel loss factor*) x (number of people) x (factor based upon posture/mission) x (combat effectiveness value (CEV) of opponent. up to 1.5) x (factor for surprise) x (opposition factor based on force ratios) x (factor based on force size) x (factor based on terrain) x (factor based upon weather) x (factor based upon season) x (factor based upon rate of advance) x (factor based upon amphibious and river crossings) x (day/night) x (factor based upon daily fatigue) = Number of casualties
* Different for attacker (.04) and defender (.06)
The special conditions mentioned in Numbers, Predictions, and War are not accounted for here, although it is possible to insert them, if required.
All these tables have been revised and refined from Numbers, Predictions, and War.
In Numbers, Predictions and War, the highest multiplier for size was 2.0, and this was for forces of less than 5,000 men. From 5,000 to 10,000 is 1.5 and from 10,000 to 20,000 is 1.0. This formulation certainly fit the data to which the model was validated.
The TNDM has the following table for values below 15,000 men (which is 1.0):
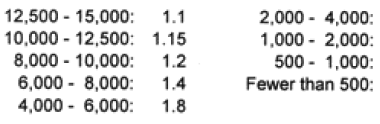 The highest percent losses the attacker can suffer in a force of greater than 15,000 men in one day is “over” 100%. If one leaves out three large multipliers for special conditions—surprise, amphibious assault, and CEV—then the maximum percent losses is 18%. The multiplier for complete surprise is 2.5 (although this degraded by historical period), 2.00 for amphibious attack across a beach, and 1.5 for enemy having a noticeable superior CEVs In the case of the defender, leaving out these three factors, the maximum percent casualties is 21.6% a day.
This means at force strengths of less than 2,000 it would be possible for units to suffer 100% losses without adding in conditions like surprise.
The following TNDM tables have been modified from the originals in Numbers, Predictions, and War to include a casualty factor, among other updates (numbers in quotes refer to tables in the TNDM, the others refer to tables in Numbers, Predictions, and War):
Table 1/”2”: Terrain Factors
Table 2/“3″: Weather Factors
Table 3/“4″: Season Factors
Table 5/”6″: Posture Factors
Table 6/“9″: Shoreline Vulnerability
Table 9/”11″: Surprise
The following tables have also been modified from the original QJM as outlined in Numbers, Predictions, and War:
Table “1”: OLl’s
Table “13”: Advance Rates
Table “16”: Opposition Factor
Table “17”: Strength/Size Attrition Factors
Table “20”: Maximum Depth Factor
The following tables have remained the same:
Table 4/“5”: Effects of Air Superiority
Table 7/“12”: Morale Factors
Table 8/“19”: Mission Accomplishment
Table “14″: Road Quality Factors
Table “15”: River or Stream Factor
The following new tables have been added:
Table “7”: Qualitative Significance of Quantity
Table “8”: Weapons Sophistication
Table “10”: Fatigue Factors
Table “18”: Velocity Factor
Table “20”: Maximum Depth Factor
The following tables has been deleted and the effect subsumed into another table:
unnumbered: Mission Factor
unnumbered: Minefield Factors
As far as I can tell, Table “20”: Maximum Depth Factor has a very limited impact on the model outcomes. Table “1”: OLIs, has no impact on model outcomes
I have developed a bad habit, if I want to understand or know something about the TNDM, to grab my copy of Numbers, Predictions, and War for reference. As shown by these attrition calculations, the TNDM has developed enough from its original form that the book is no longer a good description of it. The TNDM has added in an additional level of sophistication that was not in the QJM.
The TNDM does not have any procedure for calculating combat from before 1900. In fact, the TNDM is not intended to be used in its current form for any combat before WWII.
