Having looked at casualty exchanges from my book War by Numbers and in the previous post, it is clear that there are notable differences between the German and Soviet armies, and between the Israeli and Arab armies. These differences show up in the force ratio tables, in the percent of wins, and in the casualty exchange ratios. As shown above, there is also a difference between the German and the U.S. and UK armies in Italy 1943-44, but this difference is no where to the same degree. These differences show up in the casualty exchange ratios. They also will show up in the force ratio comparisons that follow.
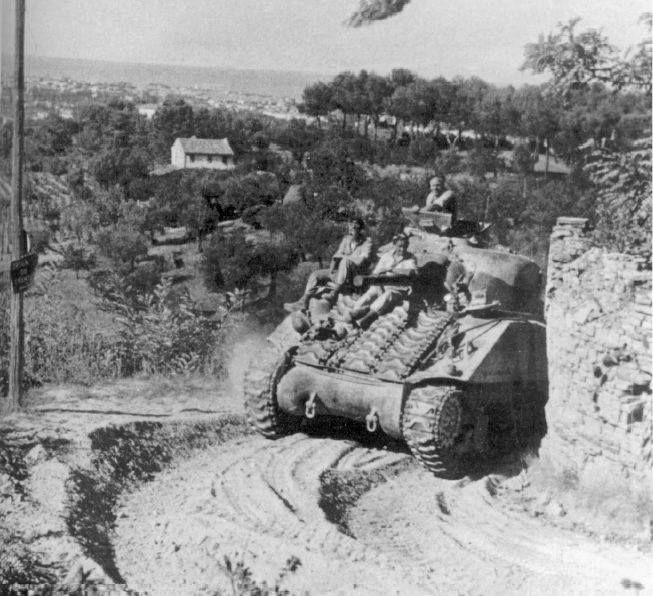
The Italian Campaign is an untapped goldmine for research into human factors. In addition to German, American and British armies, there were Brazilian, Canadian, French, French Algerian, French Moroccan, Greek, Indian, Italian, New Zealander, Polish, and South African forces there, among others like the Jewish brigade. There was also an African-American Division and a Japanese-American battalion and regiment actively engaged in this theater. Also the German records are much better than they were in the second half of 1944. So, the primary source data these engagements are built from are better than the engagements from the ETO.
We have 137 engagements from the Italian Campaign. There are 136 from 9 September to 4 June 1944 and one from13-17 September 1944. Of those, 70 consisted of the Americans attacking, 49 consisted of armed forces of the United Kingdom in the offense, and 18 consisted of the Germans attacks, often limited and local counterattacks (eight attacks against the United States and ten attacks against the UK). So, let us compare these based upon force ratios.
American Army attacking the German Army, Italy 1943-44
(70 cases in the complete data set, 62 cases in the culled data set)
Force Ratio……………Percent Attacker Wins………………..Number of Cases
1.22 to 1.49……………………….42%………………………………………..26
Culled…………………………………48…………………………………………21[1]
1.50 to 1.95………………………..43………………………………………….30
Culled…………………………………48…………………………………………27[2]
2.02 to 2.23………………………100…………………………………………..4
2.58 to 2.96………………………..71…………………………………………..7
3.04…………………………………100…………………………………………..1
Gap in data
4.11 to 4.25………………………100……………………………………………2
There were seven cases of engagements coded as “limited attacks” and one case of “other”. These eight cases are excluded in the table above on those lines in italics.
Needless to say, this is a fairly good performance by the American Army, with them winning more than 40% the attacks below two-to-one and pretty winning most of them (86%) at odds above two-to-one.
British Army attacking the German Army, Italy 1943-44
(49 cases in the complete data set, 39 cases in the culled data set)
Force Ratio………………..Percent Attacker Wins………………..Number of Cases
0.85………………………………….0%……………………………………………….1
1.17 to 1.41………………………60…………………………………………………5
1.50 to 1.69………………………33…………………………………………………3
2.01 to 2.49………………………50……………………………………………….12
Culled………………………………..86…………………………………………………7[3]
2.77……………………………….100………………………………………………….1
3.18 to 3.49………………………30………………………………………………..10
Culled……………………………….43…………………………………………………7[4]
3.50 to 3.73……………………..80…………………………………………………..5
4.23 to 4.99……………………..42…………………………………………………12
Culled………………………………50…………………………………………………10[5]
There were five cases of limited action and five cases of limited attack. These ten cases are excluded in the table above on those lines in italics.
This again shows the difference in performance between the American Army and the British Army. This is always an uncomfortable comparison, as this author is somewhat of an anglophile with a grandfather from Liverpool; but data is data. In this case they won 44% of the time at attacks below two-to-one, which is similar to what the U.S. Army did. But then, they only won only 63% of the time at odds above two-to-one (using the culled data set). This could just be statistical anomaly as we are only looking at 30 cases, but is does support the results we are seeing from the casualty data.
What is interesting is the mix of attacks. For the American Army 77% of the attacks were at odds below two-to-one, for the British Army only 23% of the attacks were at odds below two-to-one (using the culled data sets). While these 99 cases do not include every engagement in the Italian Campaign at that time, they include many of the major and significant ones. They are probably a good representation. This does probably reflect a little reality here, in that the British tended to be more conservative on the attack then the Americans. This is also demonstrated by the British lower average loss per engagement.[7]
The reverse, which is when the Germans are attacking, does not provide a clear picture.
German Army attacking the American and British Army, Italy 1943-44 – complete data set (18 cases)
Force Ratio…………………..Percent Attacker Wins…………………Number of Cases
0.72 to 0.84………………………….0%………………………………………………7
1.17 to 1.48………………………..50…………………………………………………6
1.89…………………………………….0…………………………………………………1
2.16 to 2.20………………………..50…………………………………………………2
Gap in data
3.12 to 3.24………………………..50…………………………………………………2
The Germans only win in 28% of the cases here. They win in 13% of the engagements versus the U.S. (8 cases) and 40% of the engagements the UK (10 cases). Still, at low odds attacks (1.17 to 1.48-to-1) they are winning 50% of the time. They are conducting 78% of their attacks at odds below two-to-one.
In the end, the analysis here is limited by the number of cases. It is hard to draw any definitive conclusions from only 18 cases of attacks. Clearly the analysis would benefit with a more exhaustive collection of engagements from the Italian Campaign. This would require a significant investment of time (and money).[8]

————————–
[1] There were four limited attacks that resulted in three defender wins and a draw. There was one “other” that was an attacker win.
[2] There three limited attacks that resulted in two defender wins and a draw.
[3] There were four “limited actions” that were defender wins and one “limited attack” that was a defender win.
[4] There as one “limited action” that was a defender win and two “limited attacks” that were defender wins.
[5] There were two “limited attacks” that were defender wins.
[6] The author’s grandfather was born in Liverpool and raised in Liverpool, England and Ryls, Wales. He served in the British merchant marine during World War I and afterwards was part of the British intervention at Murmansk Russia in 1918-1919. See the blog post:
[7] See War by Numbers, pages 25-27. The data shows that for the Americans in those 36 cases where their attack was successful they suffered an average of 353 casualties per engagement. For the 34 American attacks that were not successful they suffered an average of 351 casualties per engagement. For the UK, in the 23 cases where their attack was successful, the UK suffered an average of 213 casualties per engagement. Of the 26 cases where the UK attacks were not successful, they suffered an average of 137 casualties per engagement.
[8] Curt Johnson, the vice-president of HERO, estimated that it took an average of three man-days to create an engagement. He was involved in developing the original database that included about half of the 137 Italian Campaign engagements. My estimation parameter, including the primary source research required to conduct this is more like six days. Regardless, this would mean that just to create this 137 case database took an estimated 411 to 822 man-days, or 1.6 to 3.3 man-years of effort. Therefore, to expand this data set to a more useful number of engagements is going to take several years of effort.

Chris, your grandfather once lived in an area (Ryls, Wales) once ruled by one of my ancestors (Prince Bleddyn). Once upon a time, Normans had a rough time fighting their way through that area of marshes into the hills (or mountains as one might recall from “The Englishman Who Went Up a Hill But Came Down a Mountain” set in a different area of Wales); however, numbers eventually prevailed (over the course of centuries). I guess that also was the case for the Allies fighting their way north through Italy (although, not taking centuries).
Respecting my elder,
Neal ap Bleddyn