[The article below is reprinted from June 1997 edition of The International TNDM Newsletter.]
The Second Test of the Battalion-Level Validation:
Predicting Casualties Final Scorecard
by Christopher A. Lawrence
While writing the article on the use of armor in the Battalion-Level Operations Database (BLODB), I discovered that l had really not completed my article in the last issue on the results of the second battalion-level validation test of the TNDM, casualty predictions. After modifying the engagements for time and fanaticism. I didn’t publish a final “scorecard” of the problem engagements. This became obvious when l needed that scorecard for the article on tanks. So the “scorecards” are published here and are intended to complete the article in the previous issue on predicting casualties.
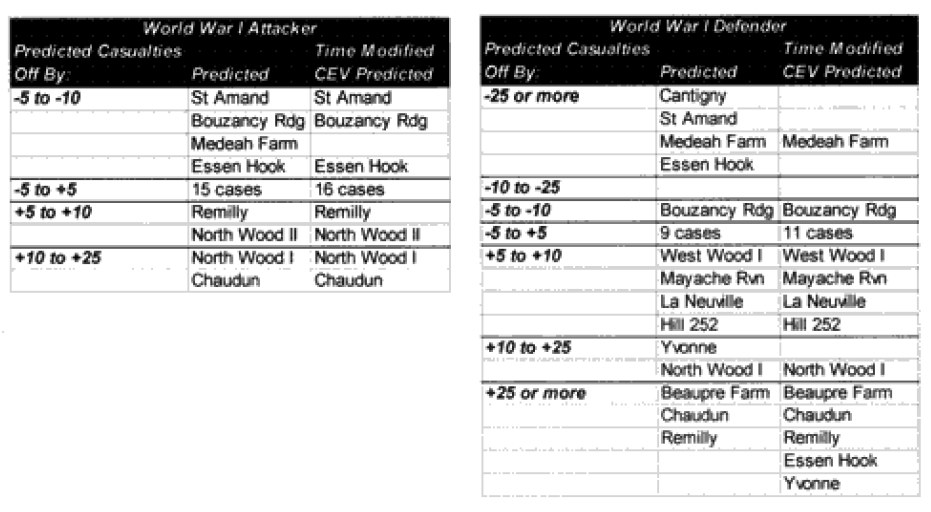
As you certainly recall, amid the 40 graphs and charts were six charts that showed which engagements were “really off.” They showed this for unmodified engagements and CEV modified engagements. We then modified the results of these engagements by the formula for time and “casualty insensitive” systems, we are now listing which engagements were still “off” after making these adjustments.
Each table lists how far each engagement was off in gross percent of error. For example, if an engagement like North Wood I had 9.6% losses for the attacker, and the model (with CEV incorporated) predicted 20.57%, then this engagement would be recorded as +10 to +25% off. This was done rather than using a ratio, for having the model predict 2% casualties when there was only 1% is not as bad of an error as having the model predicting 20% when there was only 10%. These would be considered errors of the same order of magnitude if a ratio was used. So below are the six tables.
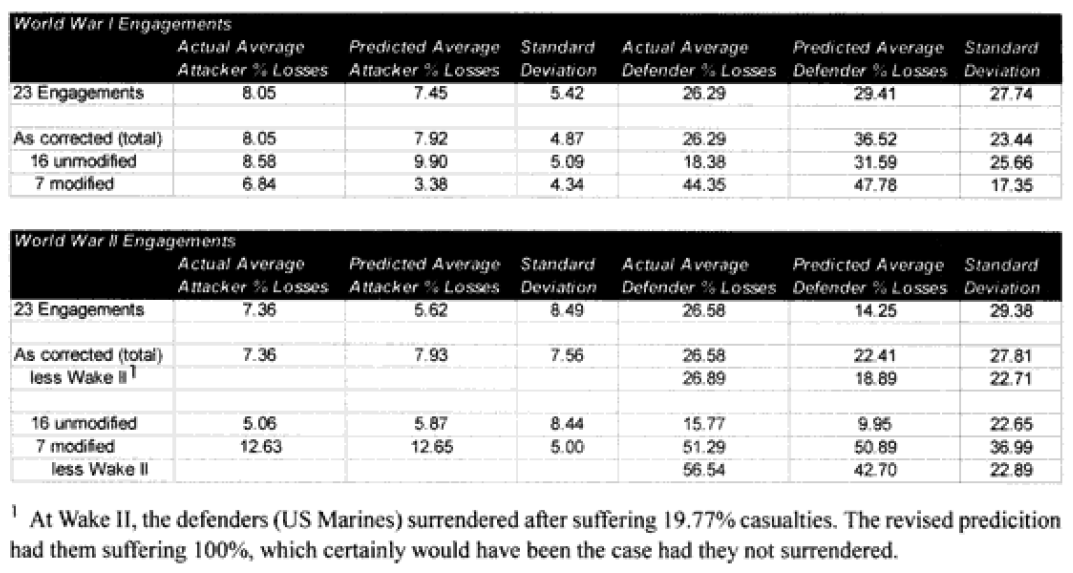
 Seven of the World War I battles were modified to account for time. In the case of the attackers we are now getting results with plus or minus 5% in 70% of the cases. In the case of the defenders, we are now getting results of plus or minus 10% in 70% of the cases. As the model doesn’t fit the defender‘s casualties as well as the attacker‘s, I use a different scaling (10% versus 5%) for what is a good fit for the two.
Two cases remain in which the predictions for the attacker are still “really off” (over 10%), while there are six (instead of the previous seven) cases in which the predictions for the defender are “really off” (over 25%).
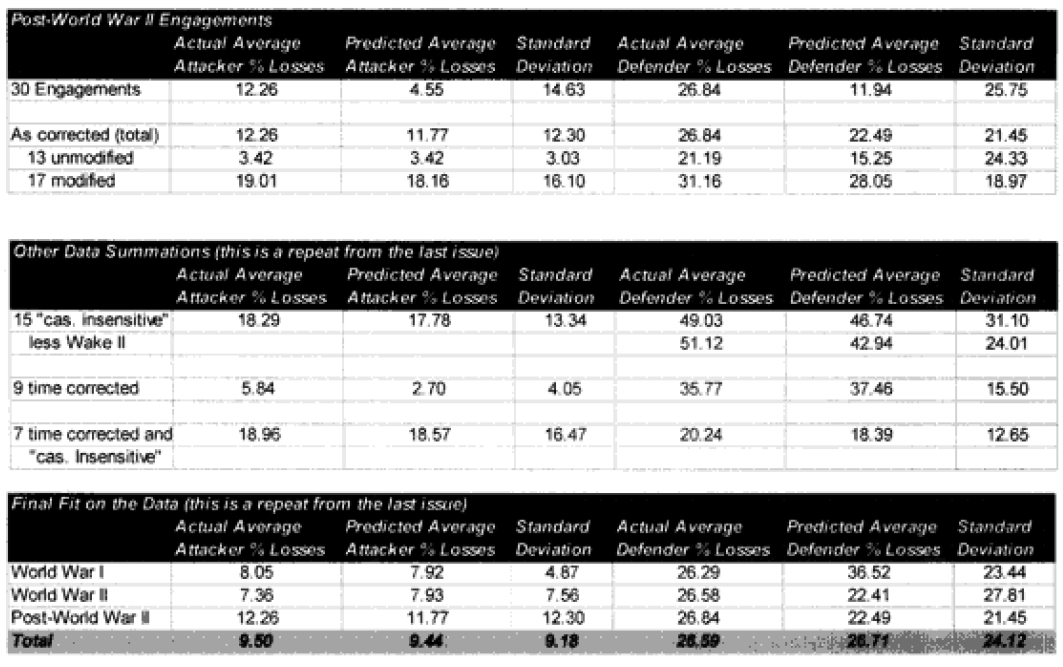
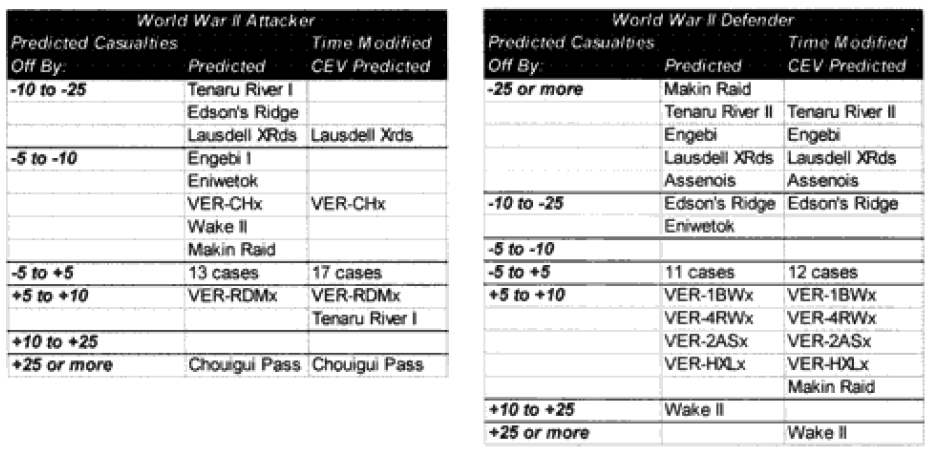 Seven of the World War II battles were modified to account for “casualty insensitive” systems (all Japanese engagements). Time was not an issue in the World War II engagements because all the battles lasted four hours or more. In the case of the attackers, we are now getting results with plus or minus 5% in almost 75% of the cases. In the case of the defenders, we are now getting results of plus or minus 10% in almost 75% of the cases. We are still maintaining the different scaling (5% versus 10%) for what is a good fit for the two.
Now in only two cases (used to be four cases) are the predictions for the attacker really off (over 10%), while there are still five cases in which the predictions for the defender are “really off” (over 25%).
Only 13 of the 30 post-World War II engagements were not changed. Two were modified for time, eight were modified for “casualty insensitive” systems, and seven were modified for both conditions.
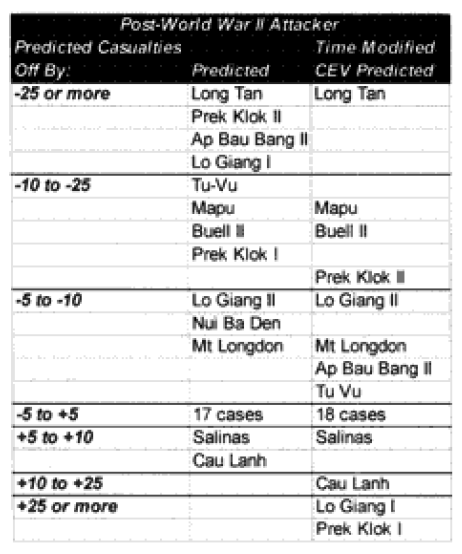 In the case of the attackers we are now getting results within plus or minus 5% in 60% of the cases. In the case of the defenders, we are now getting results within plus or minus 10% in around 55% of the cases. We are still maintaining the different scaling (5% versus 10%) for what is a good fit for the two.
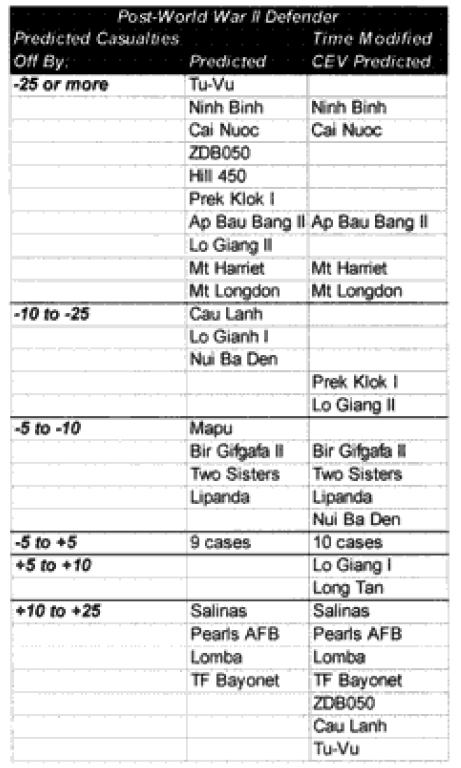 We have seven cases (used to be eight cases) in which the attacker‘s predictions are “really off” (over 10%), while there are only five cases (used to be 10) in which the defender‘s casualty predictions are “really off” (over 25%).
Repetitious Conclusion
To repeat some of the statistics from the article in the previous issue, in a slightly different format: