This is a follow-up post to the post discussing Trevor Dupuy’s work compared to the Army Research Laboratories (ARL) current work:
The work by ARL produced a graph similar to this one by Trevor Dupuy, except it was used to forecast the “figure of regularity” (which I gather means firepower or lethality). But if you note there is another significant line on Trevor Dupuy’s graph, besides the weapons’ “theoretical killing capacity.” It is labeled Dispersion. Note the left side of the graph where it is labeled “Disperion: Square Meters per Man in Combat.” It also goes up as the “theoretical killing capacity” of the weapons goes up.

This is the other side of equation. For every action, there is an equal and opposite reaction to paraphrase a famous theorist. This results in this chart from Col. Dupuy:
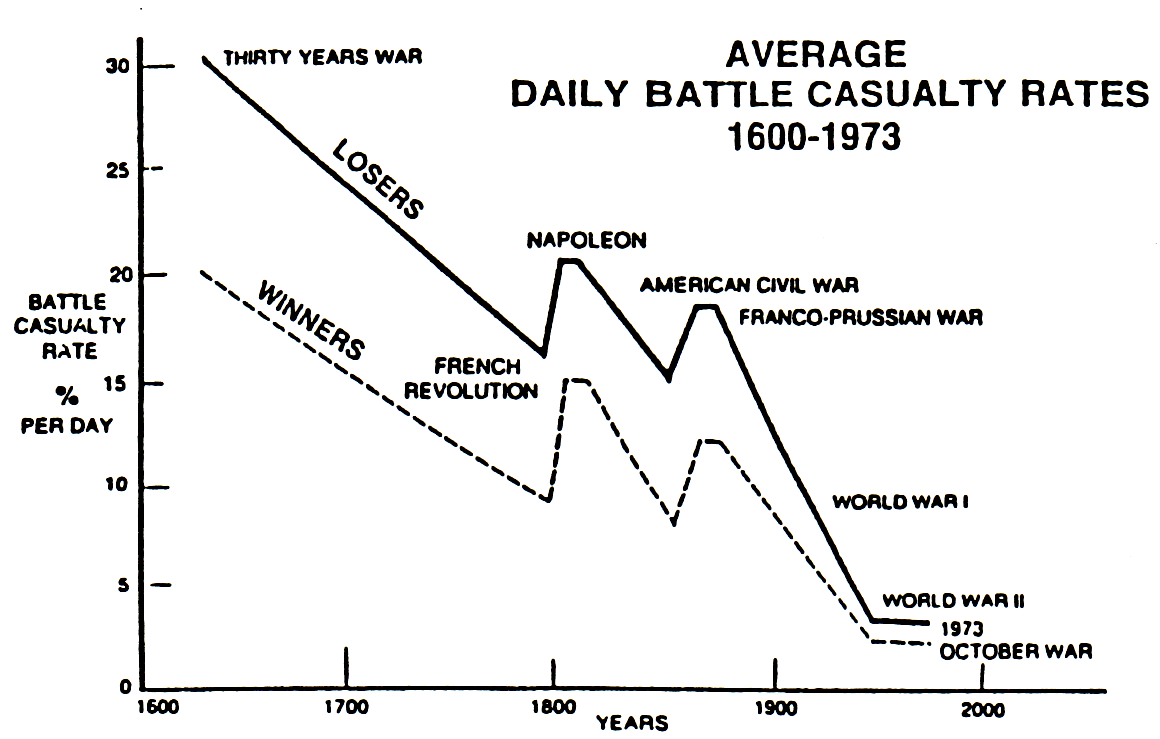
Now….this is pretty damn significant….for as firepower, or lethality, or “theoretical killing capacity” has gone up, even geometrically…..daily casualty rates have declined. What is happening? Well, not only “for every action, there is an equal and opposite reaction,” but in fact, the reaction has outweighed the increase in firepower/lethality/killing capacity over time. This is worth thinking about. For as firepower has gone up, daily casualty rates have declined.
In fact, I did discuss this in my book War By Numbers (Chapter 13: The Effects of Dispersion on Combat). Clearly there was more to “dispersion” than just dispersion, and I tried to illustrate that with this chart:
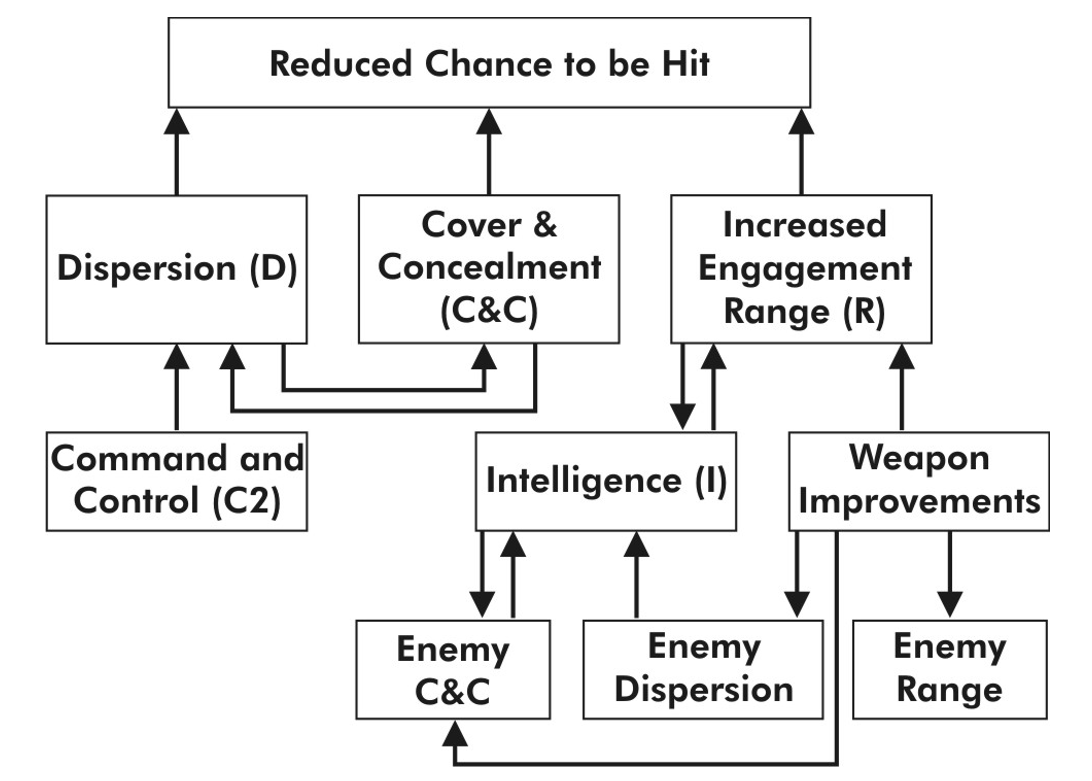
To express it in simple English, people are dispersing, increasing engagement ranges and making more individual use of cover and concealment (page 166). Improvements in weapons, which occur on both sides, have also been counteracted by changes in deployment and defense. These changes have been more significant than the increases in lethality. See pages 166-169 of War by Numbers for a more complete explanation of this chart.
The issues related to lethality and forecasting the future of lethality gets a little complex and multifaceted.

Notice that the difference between losing and winning also has gotten smaller, in terms of daily casualty rates (although not necessarily in terms of relative ratio of percentages, such that the relative ratio of percentages is 30%/20%=1.5 for Thirty Years War and roughly 3%/2%=1.5 for Yom Kippur War).
Maybe, it is now taking less time and less proportional destruction of a unit/army/etc. for the losing side to “read the writing on the wall.”
Has anyone encountered a maxim indicating that if a unit/army/etc. becomes aware that it is experiencing a casualty rate for its unit/army/etc. that is 50% higher than the casualty rate being experienced by its opponent then the losing unit/army/etc. “throws in the towel?”
I wonder whether impovements in communication and command control have led to less time being needed in order to ascertain (and act upon knowledge about) the relative casualty trend and thus the likely result.
L’Shana Tovah,
Neal
Well, it is “average” percent per day casualty rates. In most cases, the attacker outnumbered the defender. So, if the attacker had 30,000 troops and the defender has 20,000 troops and the attacker losses 20% and the defender losses 30%, then their actual losses are the same. It is their percent losses that are different.
Chris, that’s what I stated.
More importantly, what do you think about the consistency of the pattern of the loser having a daily casualty rate that is 50% higher than the winner’s daily casualty rate? Doesn’t that strike you as an interesting pattern? Might it be a maxim?
By the way, your blog clock isn’t on Daylight Saving Time (DST); of course, that soon won’t matter since DST ends on November 3 (just a month from now).
Oh, and I am referring to an internal percentage rate when I referred to “rate” in my previous comments.