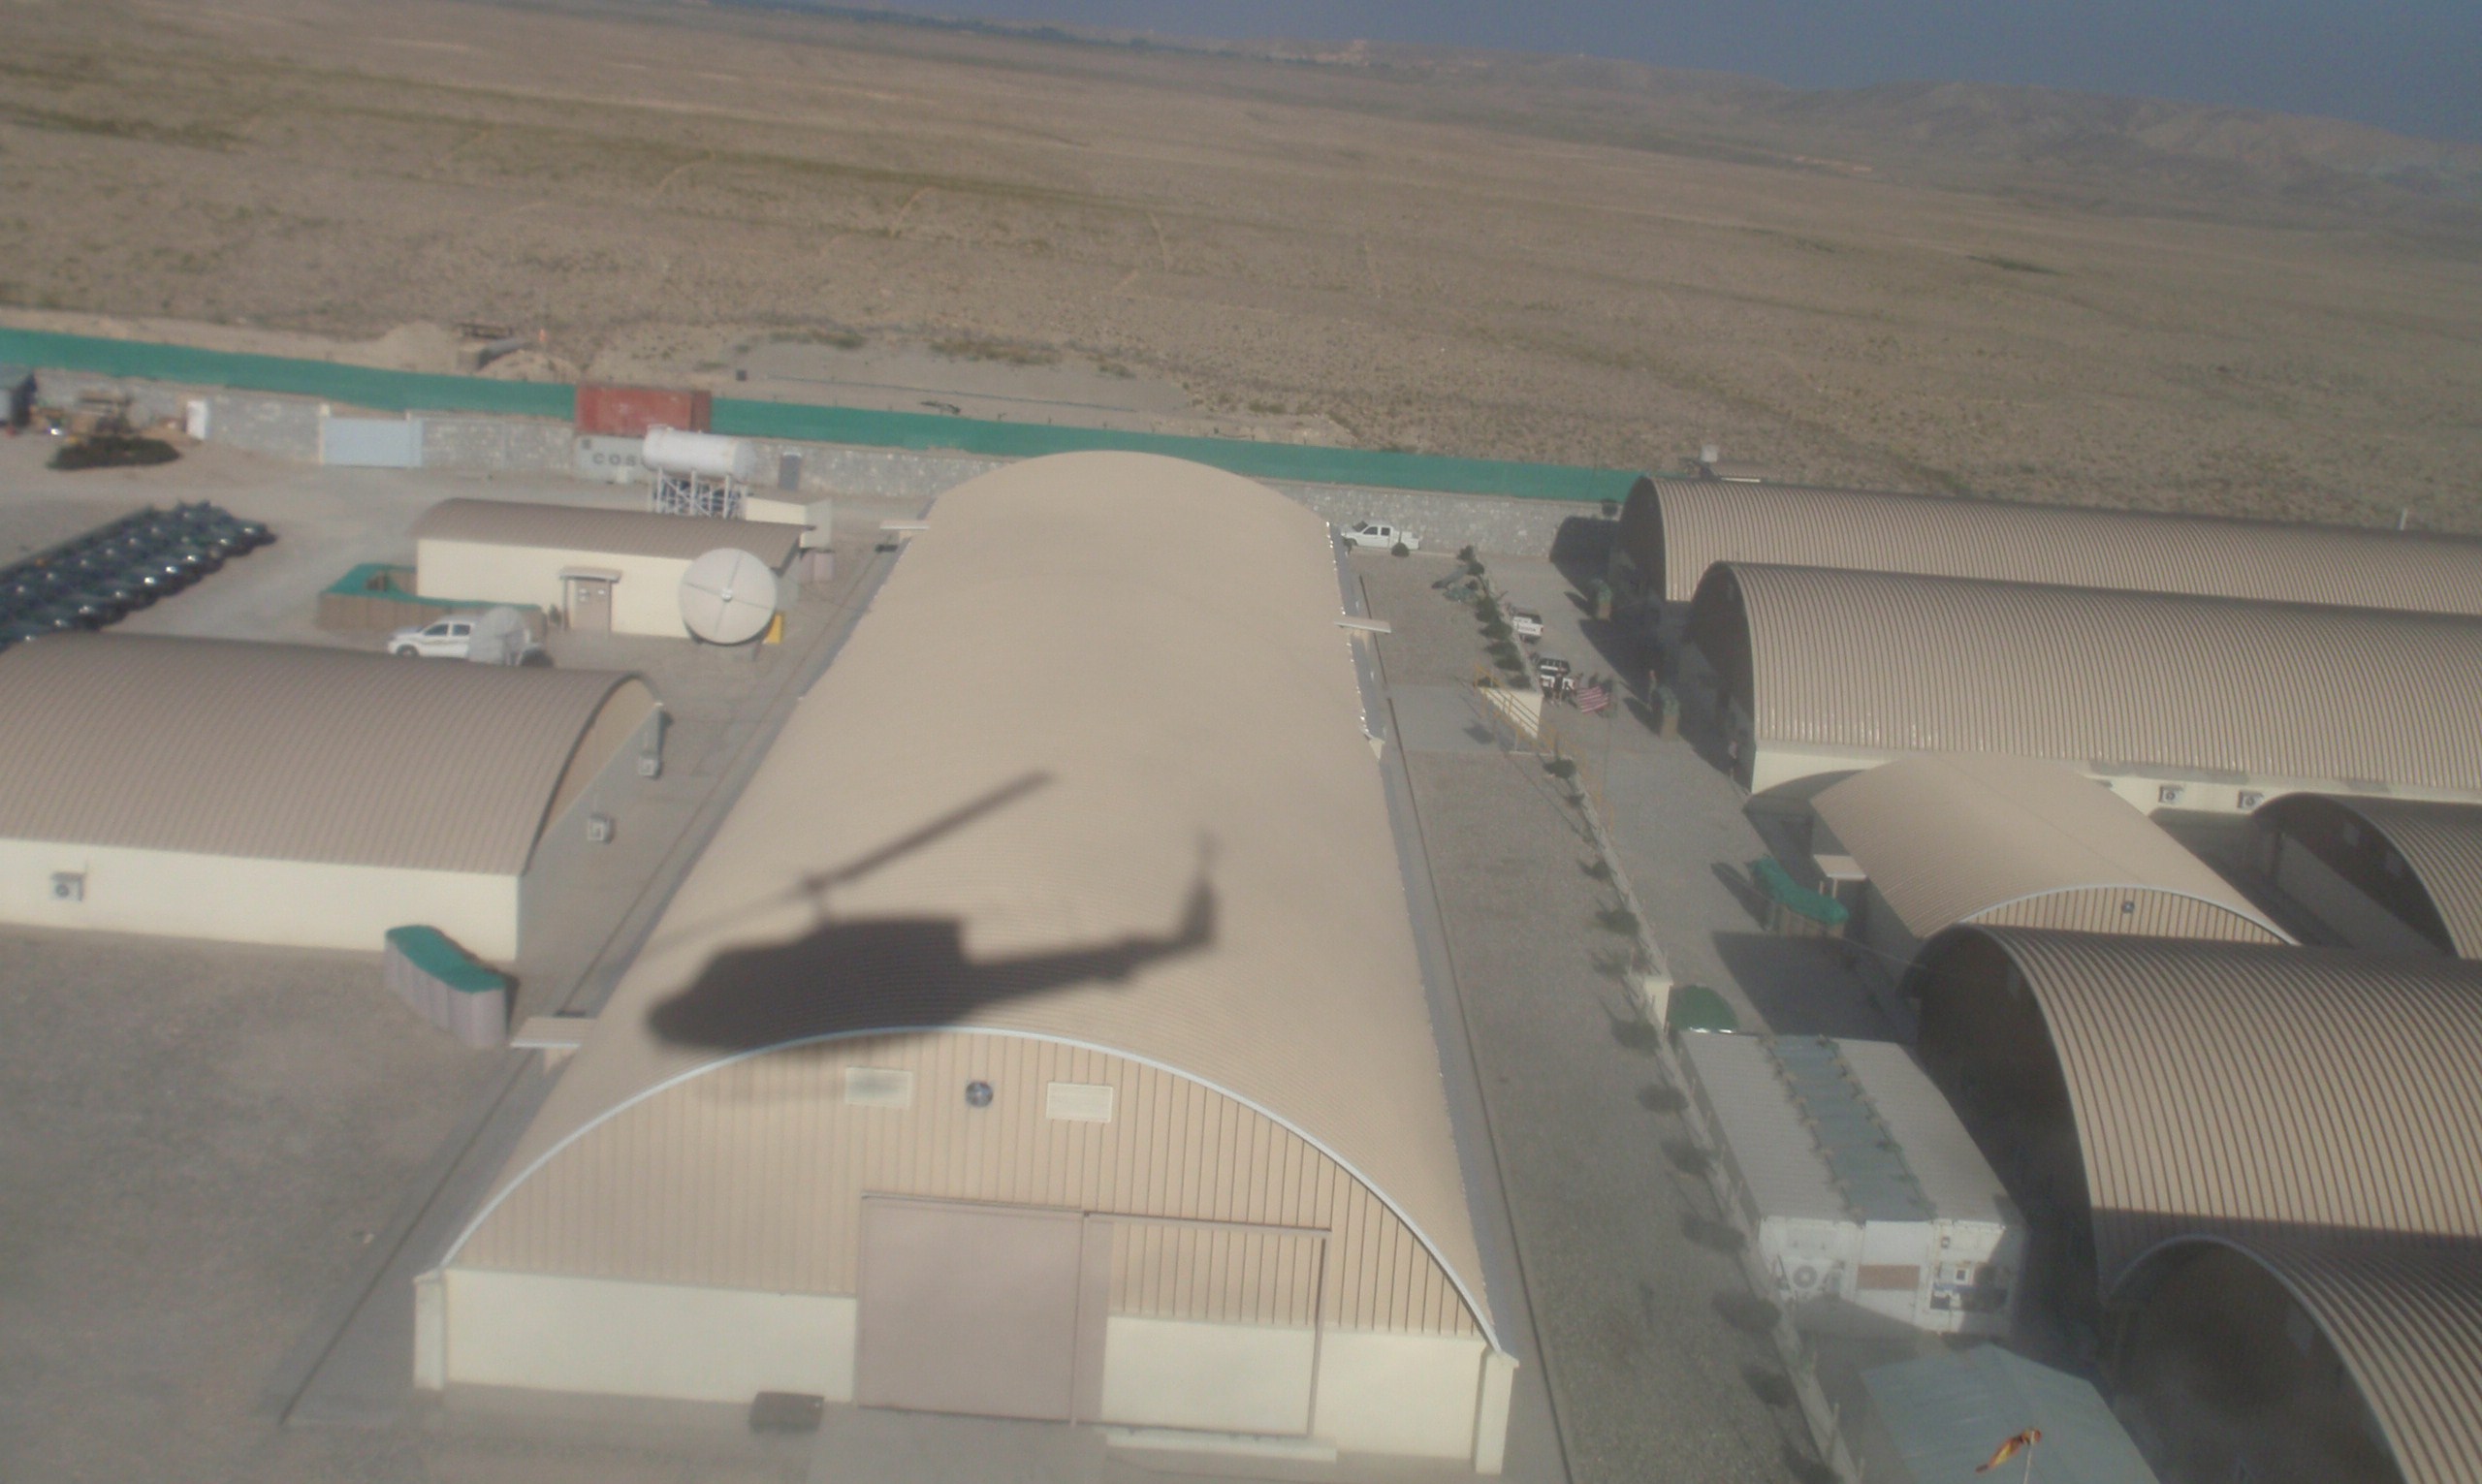
The fighting in Afghanistan continues, with a major attack reported a day ago in west Afghanistan that resulted in the death of 21 police and militia and 9 wounded: https://www.usnews.com/news/world/articles/2019-01-07/taliban-storm-security-posts-in-west-afghanistan-kill-21. This was a pretty significant fight, with the government claiming 15 Taliban militants killed and 10 wounded.
I do lean on the Secretary General reports quarterly reports on Afghanistan for my data, as it may be the most trusted source available. Those reports are here:
https://unama.unmissions.org/secretary-general-reports
So what are the current statistics?:
Security Incidences Civilian
Year Incidences Per Month Deaths
2008 8,893 741
2009 11,524 960
2010 19,403 1,617
2011 22,903 1,909
2012 18,441? 1,537? *
2013 20,093 1,674 2,959
2014 22,051 1,838 3,699
2015 22,634 1,886 3,545
2016 23,712 1,976 3,498
2017 23,744 1,979 3,438
2018 22,745 1,895 3,731 Estimated (see below)
At the start of 2013, we still had 66,000 troops in Afghanistan, although we were drawing them down. There were 251 U.S. troops killed in 2012 (310 killed from all causes) and 85 in 2013 (127 killed from all causes). Over the course of 2013, 34,000 troops were to be withdrawn and the U.S. involvement to end sometime in 2015. We did withdrawn the troops, but really have not ended our involvement. According to Wikipeida we have 18,000+ ISAF forces there (mostly American) and 20,000+ contractors. I have not checked these figures. The latest reports I have seen say around 14,000 American troops in Afghanistan. The Afghans have over 300,000 security forces (Army, Air Force, National Police, Local Police, etc.) to conduct the counterinsurgency.
The Secretary General 7 December 2018 report does note that “On 30 August, the Government complete the personnel asset inventory for existing Afghan National Police personnel…..Out of 147,875 records, 106,189 personnel were identified as legitimate for the payment of salaries. The remaining 41,686 records were removed from the payroll for such reasons as retirement, desertion and attrition.”
As we note in Chapter Twenty-One of my book America’s Modern Wars: “The 2013 figure of 20,093 incidents a year does argue for a significant insurgency force. If we use a conservative figure of 333 incidents per thousand insurgents, then we are looking at more than 60,000 full-time and part-time insurgents.”
This war does appear to be flat-lined, with no end in sight.

————————————————————————————————————-
Notes for 2018 estimates:
-
15 December 2017-15 February 2018: 3,521 security incidences (6% decrease from previous year).
-
15 February-15 May: 5,675 security incidences (7% decrease from previous year).
-
15 May – 15 August: 5,800 security incidences (10% decrease from previous year)
- 16 August – 15 November: 5,854 security incidences (2% decrease from previous year)
-
1 January – 30 September: 2,798 civilian deaths (highest number since 2014)
- UNAMA attributed 65% of all civilian casualties to anti-government elements
- 35% to Taliban
- 25% to ISIL-KP
- 5% other
- 22% to pro-government forces
- 16% to Afghan national security forces
- 5% to international military forces
- 1% to pro-government armed groups
- 10% unattributed crossfire during ground engagements
- 3% to other incidents, including explosive remnants of war and cross-border shelling
- Causes of civilian deaths
- 45% caused by improvised explosive devices.
- 29% caused by ground engagements
- More than half of those casualties (313 people killed and 336 injured) caused by aerial strikes by pro-government forces)
- UNAMA attributed 65% of all civilian casualties to anti-government elements

You say the war has “flat lined”, however the trend is clearly rising, which looks like the war is failing to achieve its objectives. Are there any prospects for this changing? Is the intervention causing the problem and not eliminating it?
I say flat lined…because if I draw a graph of incidences from 2011 to 2018…I will end up with a flat trend line. Same with civilian deaths from 2014-2018. That is effectively eight years of no real change.
I am thinking about a related follow-up post in the next couple of days.
Done. I was going to post about the Battle of Kursk today….but you distracted me. 😉
I have graphed the trend line in Excel and, although I have not been able to paste it here, it has a positive slope and a significant correlation co-efficient and so I would consider it a rising trend.
Y=86.571x – 171006
R-squared = 0.3374
You can email it to me at LawrenceTDI@aol.com