There has been a lot of statements lately coming out of Russia (Putin in particular), China and other places about how the U.S. is in decline. Not sure what is the basis of these statements. Right now the United States GDP is $19.391 Trillion. The entire world’s GDP, according to the World Bank, is $80.684 Trillion. This means that the U.S.’s GPD makes up only 24% of the world’s GDP. This hardly puts us out in the dumpster.
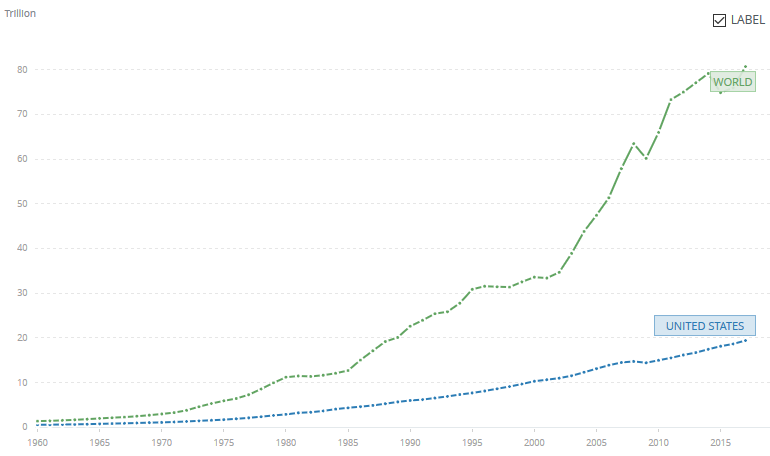
Now, it has changed over time. In 1960 the U.S. GDP was $543.3 billion while the World’s was $1.366 Trillion. This is 40%. So we have declined from having 40% of all the goods and services of the world to only having 24% of all the goods and services in the world. I would argue that in fact this is not a decline, but a growth on the part of the rest of the world, and in many cases a well-deserved growth. In fact, it was the intention of the Marshall Plan to restore the European economy for the purpose of making stable democratic economically viable counties. This is a plan that succeeded in spades. The data from 1960 is only 15 years after the devastating World War II, so it is really no surprise that the U.S. economy, living in “splendid isolationism” or at least conveniently isolated by two very large bodies of water, was in much better shape than those people who had panzers running back and forth across their front lawns.
As of 1980 the United States GDP was 26% of the world GDP. Much of this change was a result of the growth of the western European and Japanese economies. It was before the later boom of the Chinese economy. But this is close to the same percentage as it is now. Just to compare over time:
Year…………Percent GDP
1960 40%
1970 39%
1980 26%
1990 26%
2000 31%
2010 23%
2017 24%
There is definitely a trend here, but it is a trend caused by the rest of the world growing, not by the United States declining. You can definitely see the world economy growing significantly after 2000. But most significant relative shift occurred between 1970, when the U.S. economy made up 39% of the world’s economy, to 1980, when it was down to 26%. It is now 24%, so really not a hugely significant shift in the last 40 or so years from the 26% it was in 1980. Not sure how you then conclude the United States is now in decline.
In the 57 years on this graph, the U.S. GPD actually only declined in one year (2009). That is a pretty good run.

It’s what those in the field of securities (not security 🙂 refer to as “forward looking facts or statements” (i.e. for purpose of marketing or propaganda )-:
Such statements constitute forward-looking statements within the meaning of the Private Securities Litigation Reform Act of 1995. Any statements that express, or involve discussions as to, expectations, beliefs, plans, objectives, assumptions, or future events or performance, often, but not always, through the use of words or phrases such as “anticipates,” “believes,” “estimates,” “expects,” “intends,” “plans,” “predicts,” “projects,” “may result,” “may continue,” or similar expressions, are not statements of historical facts and may be forward-looking facts (i.e. wishful thinking or even disinformation )-:
Although it’s “not a hugely significant shift ” (a subjective observation), I suspect that it is a statistically significant shift. Going from 40% to 24% seems like quite a drop in the USA’s share of the world economy to me. However, just as some companies get too fixated upon market share rather than upon profit margin (or upon total profits), some countries (or analysts) might get fixated upon a country’s share of the world economy rather than upon that country’s per capita income. Might it be a reflection of a competitive outlook (pride?) rather than of a healthy outlook (utility/happiness/security/etc.)? The need for significance versus the need for security?
“Hugely significant shift” refers to the last 40 years, where we went from 26% of the world GDP to 24% of the world GDP.
I think I said that, but I will give it a slight re-write to make sure there is no confusion.
Well that is the differece between recovery and growth.
This is interesting, the impact of two World Wars (recalculated):
Year US % share of European GDP:
1905 42%
1913 37%
1937 42%
1950 68%
1990 63%
Asian economies by the way, are very dependent on the purchasing power of the Western nations.
Chris, just have your presented list extend to before 1960 (back through the years that make your point). Still, a 16% drop over 57 years is an indication of something (perhaps, some exchange rate trends in addition to the development of other countries’ economies that you mentioned). Are you using real GDP or nominal GDP? Of course, even the calculations for reporting GDP in real terms doesn’t ensure that 1960 apples and oranges are being contrasted with 2017 apples and oranges. Either way, Americans still are probably much better off when it comes to enjoying “apples and oranges” that are Russians and Chinese! Just as during the Cold War, some countries would like to portray America in a bad light and that probably accounts for the statements from Russia and China.
What was the situation in the world economies from 1960 to 1980 is very different than the situation since 1980.
Maybe a better way of measuring national power would be the surplus GDP left over after deducting some level of subsistence. That way a country whose GDP is large only because its population is large would rank low. You’d need high GDP and high per-capita GDP to rank highly.
Why not using GDP-PPP? This will give according latest statistics by IMF just 14.66% for USA while 20,10% for China. Anyway with numbers of aluminium or steel production China is producing 10-30 times more than U.S.A. Once upon a time there was an idea in America that real economy is the measure. But now making money with money (fake virtual economy) is the norm.