I am far from an expert on demographics, but it something I do occasionally pay attention to. When it comes to measuring long-term military power and world influence, the basic measurement of power is wealth times population. Or, you can simply stack the countries up by GNP. This puts Russia 11th on the list, below Canada. But looking at Russia’s population alone is useful.
As of January 2018 the population of Russia is estimated at 146.9 million people. This does make it the 9th most populous country on the planet. This does include Crimea and Sevastopol, which has 2.4 million people.
The population of Russia was in steady decline from 1991 to 2013. Even in 2017 Russia was only producing 1.61 children per women. This is below the replacement rates of 2.1. The last time the Russian fertility rate was above 2 was in 1989 and that was only for 7 years. It was below 2 for most of the time before that going back to mid-1960s. Low child birth rates and small families rates seem to be very much a part of the culture. I know a lot of Russians that are only children.

Their population is growing ever so slowly due to immigration. For 2017 they had a net migration of 211,878, and a natural population loss of 135,818. This gave them population gains of 76,060, which is a very small annual gain (0.05% gain a year). In 2010, ethnic Russians made up 77% of the total population.
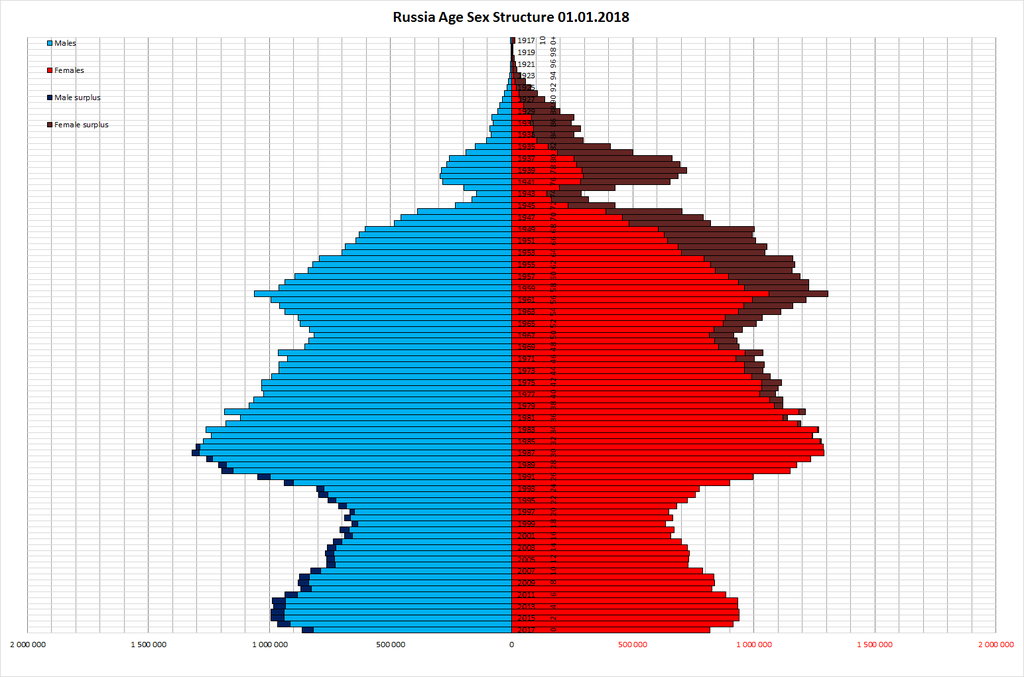
The population of Russia was 147.4 million in 1990, 148.7 million in 1991, and then it declined at a rate of 0.5% a year, dropped to 142.9 million in 2010 and has increased to 146.9 since then by immigration and seizure of Crimea and Sevastopol. In 2006 the Russian government started simplifying immigration laws, encouraging immigration of ethnic Russian from former Soviet republics. There is probably a limit to how many more people this can draw in. Russia also has about 7 million temporary migrant workers (these are 2011 figures). The Russian population tends to be older than most. The demographic “pyramid” is anything but pyramidal in shape.
As of 2018, the UN is still predicting that Russia’s population will fall to 132 million by 2050. See: https://esa.un.org/unpd/wup/Country-Profiles/
Now, lets compare the population of the Soviet Union/Russia to the United States over time:
Soviet Union/Russia United States
1951 182.3 million 151.3 (1950)
1959 209.0 179.3 (1960)
1970 241.7 203.2
1977 257.7 226.5 (1980)
1982 270.0 226.5 (1980)
1990 290.9 248.7
1991 293.0 248.7 (1990)
2002 145.2 (Russia only) 281.4 (2000)
2010 142.9 308.7
2018 146.9 328.3 (est.)
So, during the height of the “we will bury you” era the Soviet Union had a population of about 20% larger than the U.S. Russia now has a population less than half the U.S. (and a GDP of less than Canada). It appears that their population will not be growing very fast and may well continue to decline.

I prefer Dupuy’s method actually: TWM (conventional) = Military effectiveness (includes economic factors and militarization levels) variable x (potentially) total men mobilized (that is men of military age tied to those factors of development).
Examples:
1.) IDF: pop*0.19 (0.04 | 0.02), % of max population for developed countries on average, x tentative national force effectiveness = 3.31
Egypt: approx. 4.66
Including circumstantial factors, the IDF is able to win in a preemptive strike or when pursuing a defensive strategy (value rises to 5), i.e. Israel does not have the manpower to occupy Egypt.
2.) 4.18 vs 2.52 (vis Syria, historical).
3.) Russia (extrapolated), 25.97 vs US 63.51.
4.) Ukraine 6.30 vis Russia 31.40.
5.) Germany (contemporary) vis Russia: 15.91 vs 24.53.
6.) China vis US (raw): 193.06 vs 60.01. China has the largest warmaking potential on earth.
These (relative) values exclude foreign aid and possible collapse of the economy as a consequence of war strain, hence I do think that some kind of carrying capacity (K) should be introduced.