Another part of our Phase III effort was to look at post-World War II cases. This is, by its nature, invariably one-sided data. Maybe at some point we will get the Chinese, North Koreans, Vietnamese, Syrians, etc. to open up their archives to us researchers, but, except for possibly Vietnam, I don’t think that is going to happen any time in the near future. So, we ended up building our post-World War II cases primarily from U.S. data.
We added 10 engagements from the Inchon/Seoul operation in 1950. For Vietnam we added 65 division-level urban engagements from the Tet Offensive in 1968 and 57 division-level non-urban engagements. We also added 56 battalion-level urban engagements from the Tet Offensive (all in Hue). We had 14 division-level urban engagements and 65 division-level non-urban engagements from various contingencies and conventional operations from 1944 to 2003. This included ELAS Insurgency, Arab-Isreali Wars, Panama, Mogadishu, the 1991 Gulf War and Baghdad in 2003. We also added 9 battalion-level urban cases, mostly from Beirut 1982-1984.
To add it all up this was:
Urban Non-urban
Phase I (ETO) 46 91
Phase II (Kharkov/Kursk) 51 65
Phase III (Manila/PTO) 53 41
Post-WWII – Division-level 89 123
Post-WWII – Battalion-level 65 0
——- ——
Total cases 304 319
This is a lot of cases for comparisons.
Just to show how they match up (from page 28 of the report):
Attackers in Division-Level Engagements:
Urban
| PTO | Kor | Tet | Oth | ETO | EF (Ger Atk) | EF (Sov Atk) | |
| Avg Str/day | 12,099 | 28,304 | 6,294 | 10,903 | 34,601 | 17,080 | 17,001 |
| Avg Cas | 78 | 30 | 94 | 254 | 178 | 86 | 371 |
| Avg Cas/day | 78 | 30 | 39 | 59 | 169 | 86 | 371 |
| Avg % Loss/day | 0.63 | 0.71 | 0.78 | 0.56 | 0.50 | 0.49 | 1.95 |
| Wgt % Loss/day | 0.65 | 0.71 | 0.62 | 0.54 | 0.49 | 0.50 | 2.18 |
Non-urban
| PTO | Tet | Oth | ETO | EF (Ger Atk) | EF (Sov Atk) | |
| Avg Str/day | 17,445 | 13,232 | 18,991 | 21,060 | 27,083 | 27,044 |
| Avg Cas | 663 | 44 | 377 | 469 | 276 | 761 |
| Avg Cas/day | 221 | 22 | 191 | 237 | 206 | 653 |
| Avg % Loss/day | 0.83 | 0.19 | 1.56 | 1.09 | 1.00 | 2.39 |
| Wgt % Loss/day | 1.27 | 0.17 | 1.01 | 1.13 | 0.76 | 2.41 |
I will pick up more on the Phase III effort in a subsequent posting (a part 3 to this series). These charts are also on page 238 of War by Numbers.
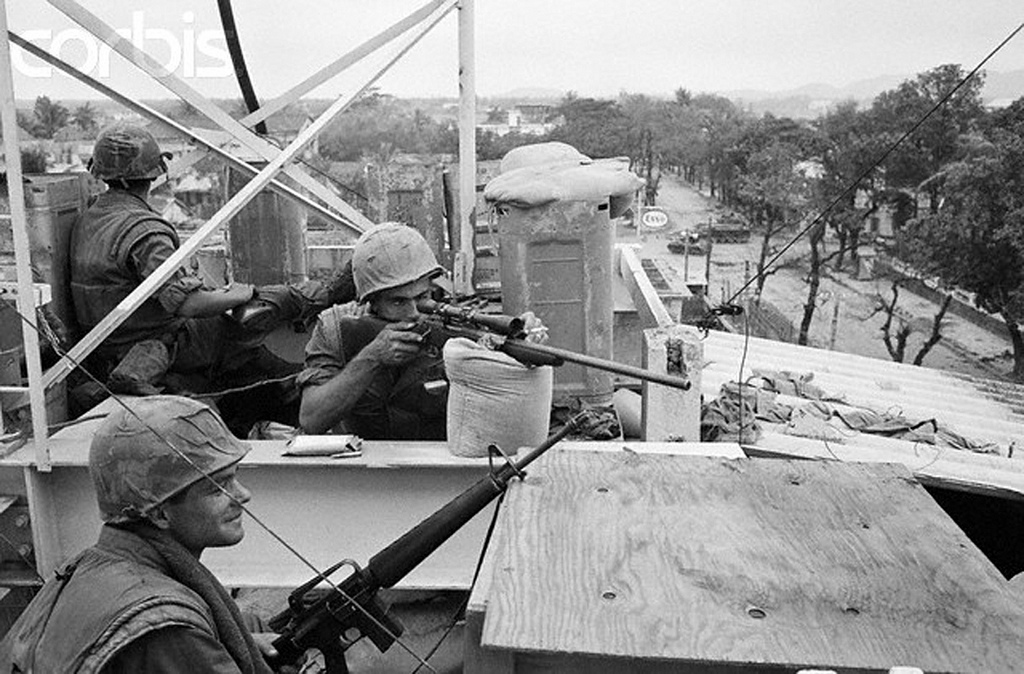
P.S. The blog the image was taken from (it is a collection of pictures taken from the fighting in Hue): https://vulep-photo.blogspot.com/2013/01/hue-1968-tet-mau-than_3410.html
